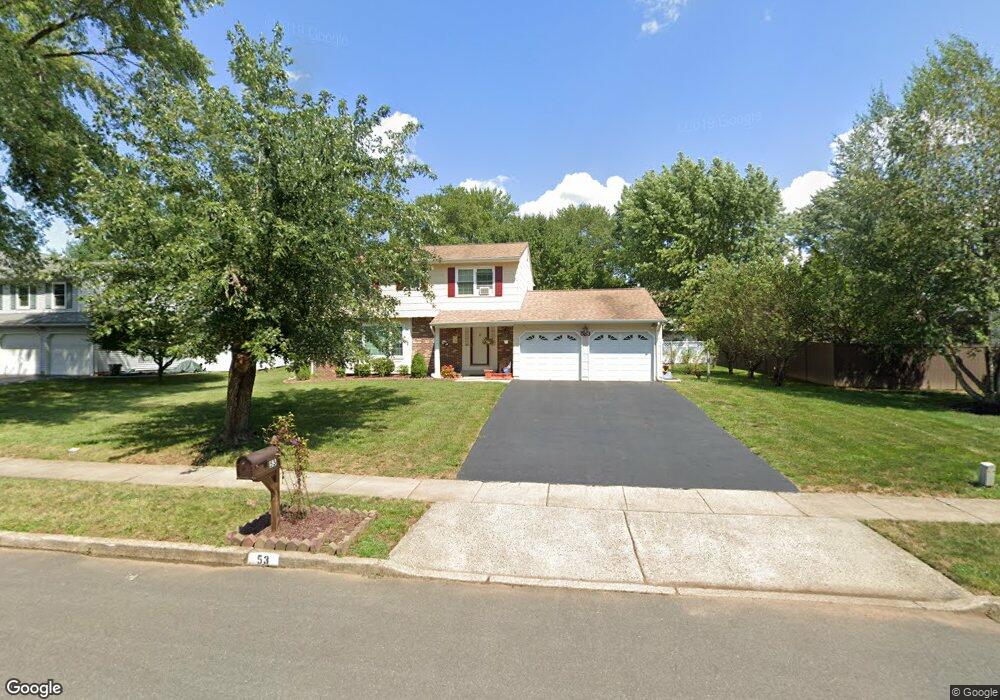
53 Colleen Cir Ewing, NJ 08638
Ewingville NeighborhoodEstimated Value: $407,000 - $637,000
Studio
--
Bath
2,324
Sq Ft
$216/Sq Ft
Est. Value
About This Home
This home is located at 53 Colleen Cir, Ewing, NJ 08638 and is currently estimated at $501,829, approximately $215 per square foot. 53 Colleen Cir is a home located in Mercer County with nearby schools including Ewing High School, Trenton Stem-To-Civics Charter School, and Guidepost Montessori at Lawrenceville.
Ownership History
Date
Name
Owned For
Owner Type
Purchase Details
Closed on
Jul 23, 2025
Sold by
Khan Mohamad Ali
Bought by
Khan Roomana R
Current Estimated Value
Purchase Details
Closed on
Sep 12, 2024
Sold by
Khan Kaniz Fatma and Khan Mohamad Ali
Bought by
Khan Mohamad Ali
Purchase Details
Closed on
May 27, 1994
Sold by
Tidey Richard
Bought by
Khan Rahman A and Kaniz Fatina
Home Financials for this Owner
Home Financials are based on the most recent Mortgage that was taken out on this home.
Original Mortgage
$117,000
Interest Rate
8.5%
Create a Home Valuation Report for This Property
The Home Valuation Report is an in-depth analysis detailing your home's value as well as a comparison with similar homes in the area
Home Values in the Area
Average Home Value in this Area
Purchase History
| Date | Buyer | Sale Price | Title Company |
|---|---|---|---|
| Khan Roomana R | -- | None Listed On Document | |
| Khan Roomana R | -- | None Listed On Document | |
| Khan Mohamad Ali | -- | None Listed On Document | |
| Khan Mohamad Ali | -- | None Listed On Document | |
| Khan Rahman A | $159,000 | -- |
Source: Public Records
Mortgage History
| Date | Status | Borrower | Loan Amount |
|---|---|---|---|
| Previous Owner | Khan Rahman A | $117,000 |
Source: Public Records
Tax History
| Year | Tax Paid | Tax Assessment Tax Assessment Total Assessment is a certain percentage of the fair market value that is determined by local assessors to be the total taxable value of land and additions on the property. | Land | Improvement |
|---|---|---|---|---|
| 2025 | $9,471 | $240,800 | $79,900 | $160,900 |
| 2024 | $8,902 | $240,800 | $79,900 | $160,900 |
Source: Public Records
Map
Nearby Homes
- 4 David Dr
- 438 Ewingville Rd
- 347 Green Ln
- 42 Running Brook Rd
- 71 Bakun Way
- 2148 Pennington Rd
- 34 Lopatcong Dr
- 4 Blossom Dr
- 23 Sundew Dr
- 256 Ewingville Rd
- 140 Crescent Ave
- 40 Arden Ave
- 138 Tulip Ln
- 6 Van Gogh Ct
- 53 Carlton Ave
- 89 Upper Ferry Rd
- 513 Eggerts Crossing Rd
- 200 Upland Ave
- 2 Sparrow Ct
- 120 Sussex St
Your Personal Tour Guide
Ask me questions while you tour the home.