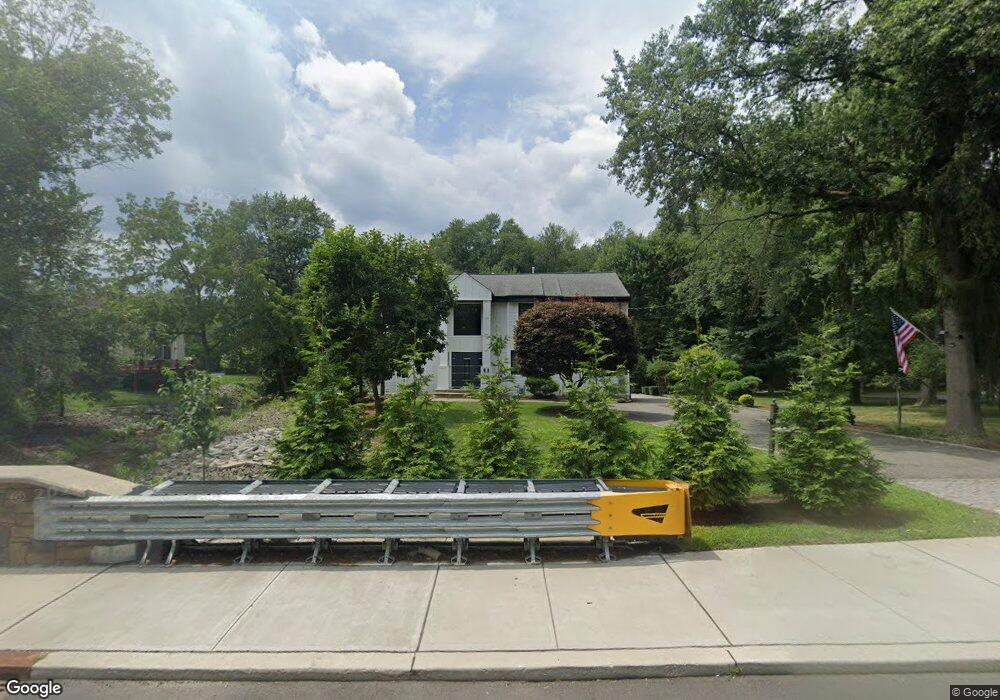
53 County Rd Demarest, NJ 07627
Estimated Value: $1,537,000 - $1,926,000
4
Beds
4
Baths
3,361
Sq Ft
$511/Sq Ft
Est. Value
About This Home
This home is located at 53 County Rd, Demarest, NJ 07627 and is currently estimated at $1,717,163, approximately $510 per square foot. 53 County Rd is a home located in Bergen County with nearby schools including County Road Elementary School, Demarest Middle School, and Luther Lee Emerson Elementary School.
Ownership History
Date
Name
Owned For
Owner Type
Purchase Details
Closed on
Aug 6, 2021
Sold by
Chang Catherine
Bought by
Fishbeyn Alexander
Current Estimated Value
Home Financials for this Owner
Home Financials are based on the most recent Mortgage that was taken out on this home.
Original Mortgage
$784,000
Interest Rate
2.8%
Mortgage Type
New Conventional
Purchase Details
Closed on
Oct 15, 2007
Sold by
Wieber Lynn M and Ross Florence L
Bought by
Chang Catherine
Purchase Details
Closed on
May 23, 2007
Sold by
Ross John E and Manna Michael A
Bought by
Ross John E and Wieber Lynn M
Purchase Details
Closed on
Oct 9, 1997
Sold by
Ross John E and Ross Florence L
Bought by
Ross Florence L
Create a Home Valuation Report for This Property
The Home Valuation Report is an in-depth analysis detailing your home's value as well as a comparison with similar homes in the area
Home Values in the Area
Average Home Value in this Area
Purchase History
| Date | Buyer | Sale Price | Title Company |
|---|---|---|---|
| Fishbeyn Alexander | $980,000 | Key Settlements Inc | |
| Fishbeyn Alexander | $980,000 | Old Republic National Title | |
| Chang Catherine | $750,000 | -- | |
| Ross John E | -- | -- | |
| Ross Florence L | -- | -- |
Source: Public Records
Mortgage History
| Date | Status | Borrower | Loan Amount |
|---|---|---|---|
| Previous Owner | Fishbeyn Alexander | $784,000 |
Source: Public Records
Tax History Compared to Growth
Tax History
| Year | Tax Paid | Tax Assessment Tax Assessment Total Assessment is a certain percentage of the fair market value that is determined by local assessors to be the total taxable value of land and additions on the property. | Land | Improvement |
|---|---|---|---|---|
| 2025 | $25,985 | $1,549,700 | $749,900 | $799,800 |
| 2024 | $25,559 | $850,000 | $416,600 | $433,400 |
| 2023 | $24,867 | $875,900 | $416,600 | $459,300 |
| 2022 | $24,867 | $875,900 | $416,600 | $459,300 |
| 2021 | $24,254 | $875,900 | $416,600 | $459,300 |
| 2020 | $23,684 | $875,900 | $416,600 | $459,300 |
| 2019 | $23,001 | $875,900 | $416,600 | $459,300 |
| 2018 | $22,292 | $875,900 | $416,600 | $459,300 |
| 2017 | $21,757 | $875,900 | $416,600 | $459,300 |
| 2016 | $21,416 | $875,900 | $416,600 | $459,300 |
| 2015 | $21,127 | $875,900 | $416,600 | $459,300 |
| 2014 | $20,671 | $875,900 | $416,600 | $459,300 |
Source: Public Records
Map
Nearby Homes
- 57 County Rd
- 5 Lauren Pond Ct
- 1 Lauren Pond Ct
- 10 Isabella Way
- 60 County Rd
- 65 County Rd
- 65 County Rd Unit B
- 65 County Rd Unit A
- 9 Lauren Pond Ct
- 35 County Rd
- 9 Isabella Way
- 46 County Rd
- 5 Isabella Way
- 66 County Rd
- 8 Lauren Pond Ct
- 2 Glenwood Ave
- 10 Carlotta Way
- 31 County Rd
- 79 County Rd
- 74 County Rd