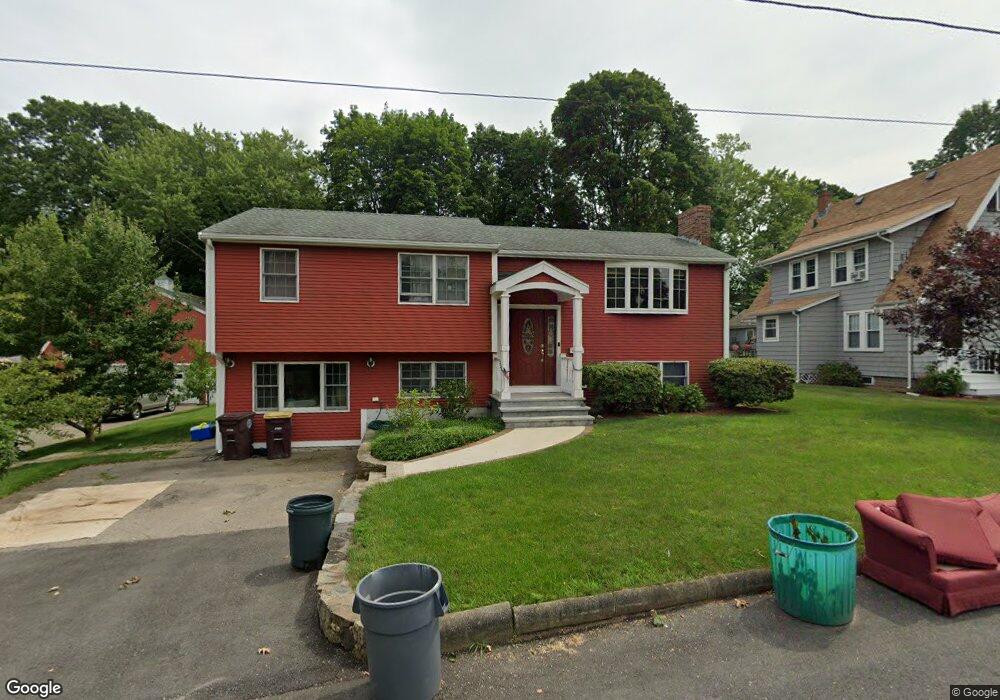
53 Cranberry Rd Weymouth, MA 02188
Weymouth Landing NeighborhoodEstimated Value: $570,000 - $678,000
--
Bed
2
Baths
1,012
Sq Ft
$607/Sq Ft
Est. Value
About This Home
This home is located at 53 Cranberry Rd, Weymouth, MA 02188 and is currently estimated at $614,546, approximately $607 per square foot. 53 Cranberry Rd is a home located in Norfolk County with nearby schools including Frederick C Murphy, Abigail Adams Middle School, and Weymouth Middle School Chapman.
Ownership History
Date
Name
Owned For
Owner Type
Purchase Details
Closed on
Nov 30, 1995
Sold by
Matterazzo Joseph A and Matterazzo Patricia A
Bought by
Thoms Stephen E
Current Estimated Value
Home Financials for this Owner
Home Financials are based on the most recent Mortgage that was taken out on this home.
Original Mortgage
$112,700
Interest Rate
7.37%
Mortgage Type
Purchase Money Mortgage
Create a Home Valuation Report for This Property
The Home Valuation Report is an in-depth analysis detailing your home's value as well as a comparison with similar homes in the area
Home Values in the Area
Average Home Value in this Area
Purchase History
| Date | Buyer | Sale Price | Title Company |
|---|---|---|---|
| Thoms Stephen E | $157,700 | -- |
Source: Public Records
Mortgage History
| Date | Status | Borrower | Loan Amount |
|---|---|---|---|
| Open | Thoms Stephen E | $115,000 | |
| Closed | Thoms Stephen E | $112,700 | |
| Previous Owner | Thoms Stephen E | $150,000 |
Source: Public Records
Tax History Compared to Growth
Tax History
| Year | Tax Paid | Tax Assessment Tax Assessment Total Assessment is a certain percentage of the fair market value that is determined by local assessors to be the total taxable value of land and additions on the property. | Land | Improvement |
|---|---|---|---|---|
| 2025 | $5,619 | $556,300 | $237,900 | $318,400 |
| 2024 | $5,462 | $531,800 | $226,600 | $305,200 |
| 2023 | $5,170 | $494,700 | $209,800 | $284,900 |
| 2022 | $5,066 | $442,100 | $185,500 | $256,600 |
| 2021 | $4,862 | $414,100 | $185,500 | $228,600 |
| 2020 | $4,767 | $399,900 | $185,500 | $214,400 |
| 2019 | $4,665 | $384,900 | $178,300 | $206,600 |
| 2018 | $4,578 | $366,200 | $169,800 | $196,400 |
| 2017 | $4,428 | $345,700 | $161,800 | $183,900 |
| 2016 | $4,282 | $334,500 | $155,500 | $179,000 |
| 2015 | $4,084 | $316,600 | $155,500 | $161,100 |
| 2014 | $3,999 | $300,700 | $144,700 | $156,000 |
Source: Public Records
Map
Nearby Homes
- 294 Commercial St
- 114 Broad St Unit D
- 114 Broad St Unit C
- 19 Vine St Unit 3
- 19 Vine St Unit 1
- 11 Richmond St
- 122 Washington St Unit 22
- 286 Broad St
- 23-25 Lindbergh Ave
- 15 1st St
- 16 Lindbergh Ave
- 38 Idlewell St
- 12 Klasson Ln
- 367 Essex St
- 36 Brookside Rd
- 286 Essex St
- 76 Kingman St
- 70 Biscayne Ave
- 15 Summer St
- 33 Congress St