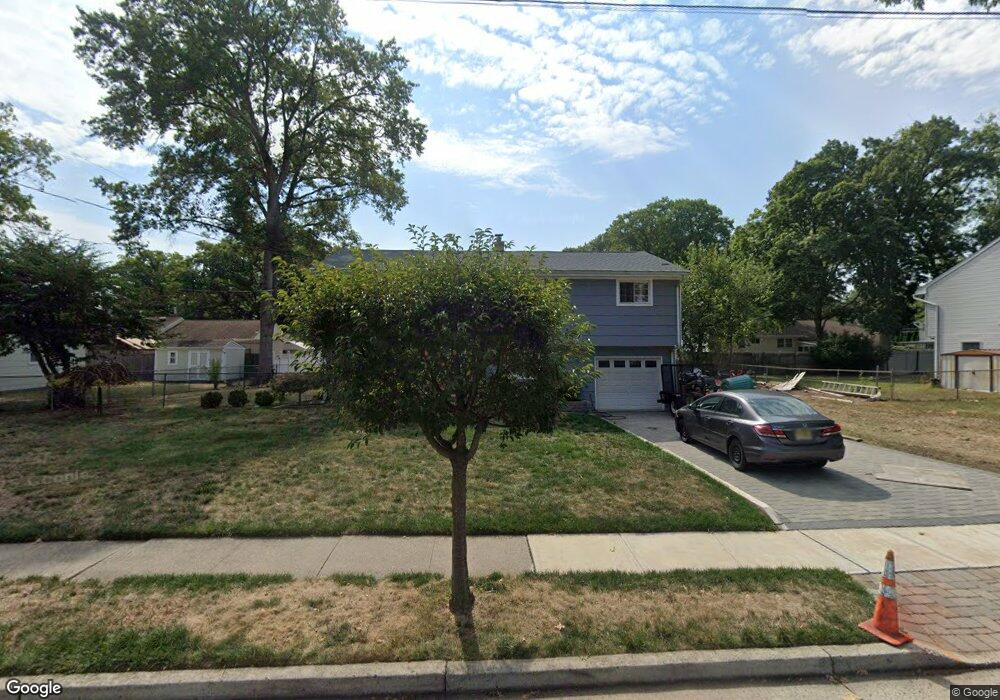
53 Curtis Ave Piscataway, NJ 08854
Estimated Value: $616,000 - $712,000
--
Bed
3
Baths
1,800
Sq Ft
$361/Sq Ft
Est. Value
About This Home
This home is located at 53 Curtis Ave, Piscataway, NJ 08854 and is currently estimated at $649,642, approximately $360 per square foot. 53 Curtis Ave is a home located in Middlesex County with nearby schools including Arbor Intermediate School, Dwight D. Eisenhower School, and Quibbletown Middle School.
Ownership History
Date
Name
Owned For
Owner Type
Purchase Details
Closed on
Sep 29, 2020
Sold by
Ward Lawren Ann and Lawren Ann Ward Revocable Trus
Bought by
Ruiz Soriano Marta L and Moz Anguilar Oscar
Current Estimated Value
Home Financials for this Owner
Home Financials are based on the most recent Mortgage that was taken out on this home.
Original Mortgage
$288,000
Outstanding Balance
$256,161
Interest Rate
2.9%
Mortgage Type
New Conventional
Estimated Equity
$393,481
Purchase Details
Closed on
Apr 1, 2014
Sold by
Ward Lawrence S and Ward Jean A
Bought by
Ward Lawren Ann and Lawren Ann Ward Revocable Trust
Create a Home Valuation Report for This Property
The Home Valuation Report is an in-depth analysis detailing your home's value as well as a comparison with similar homes in the area
Home Values in the Area
Average Home Value in this Area
Purchase History
| Date | Buyer | Sale Price | Title Company |
|---|---|---|---|
| Ruiz Soriano Marta L | $360,000 | Advanced Ttl & Abstract Llc | |
| Ward Lawren Ann | -- | None Available |
Source: Public Records
Mortgage History
| Date | Status | Borrower | Loan Amount |
|---|---|---|---|
| Open | Ruiz Soriano Marta L | $288,000 |
Source: Public Records
Tax History Compared to Growth
Tax History
| Year | Tax Paid | Tax Assessment Tax Assessment Total Assessment is a certain percentage of the fair market value that is determined by local assessors to be the total taxable value of land and additions on the property. | Land | Improvement |
|---|---|---|---|---|
| 2025 | $9,087 | $576,200 | $268,200 | $308,000 |
| 2024 | $8,759 | $465,300 | $173,000 | $292,300 |
| 2023 | $8,759 | $419,100 | $173,000 | $246,100 |
| 2022 | $8,536 | $379,200 | $173,000 | $206,200 |
| 2021 | $7,980 | $340,800 | $173,000 | $167,800 |
| 2020 | $7,379 | $315,900 | $158,000 | $157,900 |
| 2019 | $7,512 | $315,900 | $158,000 | $157,900 |
| 2018 | $7,285 | $306,600 | $158,000 | $148,600 |
| 2017 | $6,949 | $252,700 | $118,000 | $134,700 |
| 2016 | $6,815 | $252,700 | $118,000 | $134,700 |
| 2015 | $6,722 | $252,700 | $118,000 | $134,700 |
| 2014 | $6,570 | $252,700 | $118,000 | $134,700 |
Source: Public Records
Map
Nearby Homes