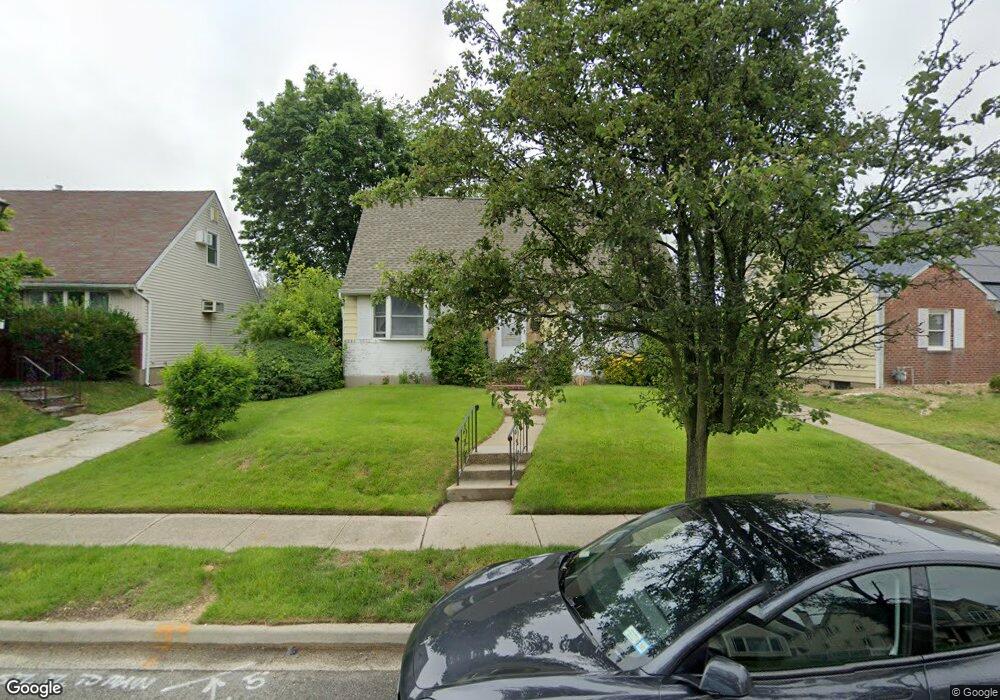
53 Daley St New Hyde Park, NY 11040
Estimated Value: $951,000 - $962,321
--
Bed
2
Baths
1,399
Sq Ft
$684/Sq Ft
Est. Value
About This Home
This home is located at 53 Daley St, New Hyde Park, NY 11040 and is currently estimated at $956,661, approximately $683 per square foot. 53 Daley St is a home located in Nassau County with nearby schools including Herricks High School, Herricks Middle School, and St. Aidan School - Lower Campus.
Ownership History
Date
Name
Owned For
Owner Type
Purchase Details
Closed on
Nov 17, 2011
Sold by
Austin Victoria Amy and Austin Dorothea Banner Irrevoc
Bought by
Bao Jian and Chen Nan
Current Estimated Value
Home Financials for this Owner
Home Financials are based on the most recent Mortgage that was taken out on this home.
Original Mortgage
$269,400
Outstanding Balance
$184,413
Interest Rate
4.1%
Mortgage Type
Purchase Money Mortgage
Estimated Equity
$772,248
Purchase Details
Closed on
Jul 30, 2002
Sold by
Banner Gerson
Purchase Details
Closed on
Oct 14, 1996
Create a Home Valuation Report for This Property
The Home Valuation Report is an in-depth analysis detailing your home's value as well as a comparison with similar homes in the area
Home Values in the Area
Average Home Value in this Area
Purchase History
| Date | Buyer | Sale Price | Title Company |
|---|---|---|---|
| Bao Jian | $449,000 | -- | |
| -- | -- | -- | |
| -- | -- | -- |
Source: Public Records
Mortgage History
| Date | Status | Borrower | Loan Amount |
|---|---|---|---|
| Open | Bao Jian | $269,400 |
Source: Public Records
Tax History Compared to Growth
Tax History
| Year | Tax Paid | Tax Assessment Tax Assessment Total Assessment is a certain percentage of the fair market value that is determined by local assessors to be the total taxable value of land and additions on the property. | Land | Improvement |
|---|---|---|---|---|
| 2025 | $15,782 | $665 | $347 | $318 |
| 2024 | $4,966 | $665 | $347 | $318 |
| 2023 | $14,599 | $665 | $347 | $318 |
| 2022 | $14,599 | $665 | $347 | $318 |
| 2021 | $14,451 | $646 | $337 | $309 |
| 2020 | $14,081 | $885 | $870 | $15 |
| 2019 | $13,385 | $885 | $870 | $15 |
| 2018 | $12,740 | $885 | $0 | $0 |
| 2017 | $7,835 | $902 | $870 | $32 |
| 2016 | $11,439 | $902 | $745 | $157 |
| 2015 | $3,433 | $902 | $745 | $157 |
| 2014 | $3,433 | $902 | $745 | $157 |
| 2013 | $3,809 | $1,054 | $870 | $184 |
Source: Public Records
Map
Nearby Homes