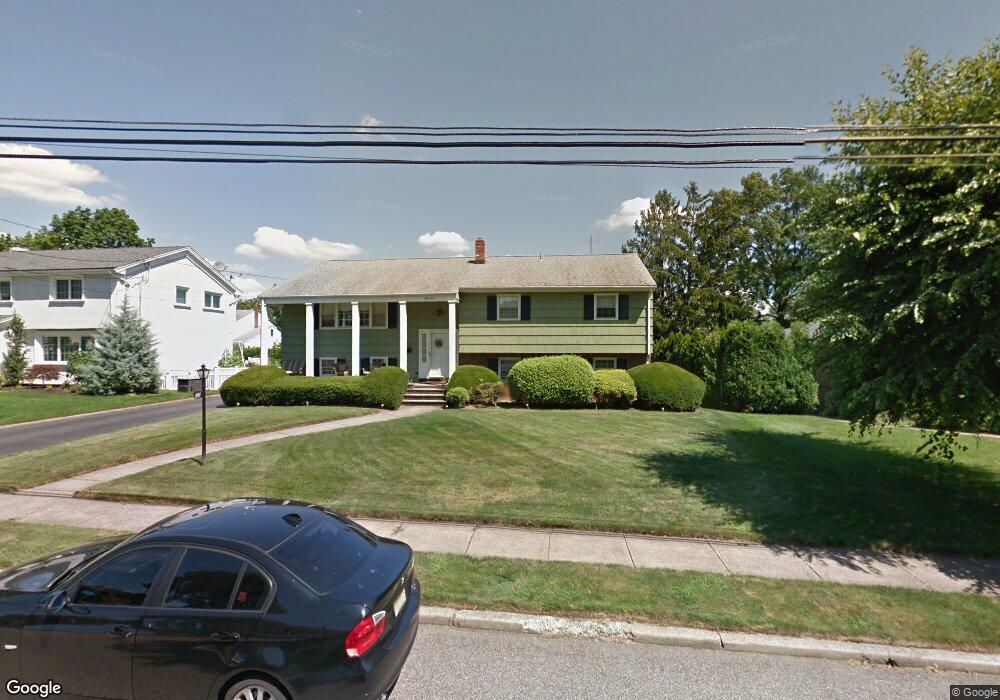
53 Daniels Dr Clifton, NJ 07013
Montclair Heights NeighborhoodEstimated Value: $866,000 - $1,035,000
--
Bed
--
Bath
2,632
Sq Ft
$354/Sq Ft
Est. Value
About This Home
This home is located at 53 Daniels Dr, Clifton, NJ 07013 and is currently estimated at $931,366, approximately $353 per square foot. 53 Daniels Dr is a home located in Passaic County with nearby schools including Clifton High School and Lacordaire Academy.
Ownership History
Date
Name
Owned For
Owner Type
Purchase Details
Closed on
Jun 13, 2011
Sold by
Ardan Robert
Bought by
Fraher Michael K and Shefchik Melanie L
Current Estimated Value
Home Financials for this Owner
Home Financials are based on the most recent Mortgage that was taken out on this home.
Original Mortgage
$320,000
Outstanding Balance
$220,946
Interest Rate
4.74%
Mortgage Type
Purchase Money Mortgage
Estimated Equity
$710,421
Create a Home Valuation Report for This Property
The Home Valuation Report is an in-depth analysis detailing your home's value as well as a comparison with similar homes in the area
Home Values in the Area
Average Home Value in this Area
Purchase History
| Date | Buyer | Sale Price | Title Company |
|---|---|---|---|
| Fraher Michael K | $401,000 | -- |
Source: Public Records
Mortgage History
| Date | Status | Borrower | Loan Amount |
|---|---|---|---|
| Open | Fraher Michael K | $320,000 |
Source: Public Records
Tax History Compared to Growth
Tax History
| Year | Tax Paid | Tax Assessment Tax Assessment Total Assessment is a certain percentage of the fair market value that is determined by local assessors to be the total taxable value of land and additions on the property. | Land | Improvement |
|---|---|---|---|---|
| 2025 | $15,831 | $266,700 | $132,100 | $134,600 |
| 2024 | $15,453 | $266,700 | $132,100 | $134,600 |
| 2022 | $15,229 | $266,700 | $132,100 | $134,600 |
| 2021 | $14,602 | $266,700 | $132,100 | $134,600 |
| 2020 | $14,650 | $266,700 | $132,100 | $134,600 |
| 2019 | $14,546 | $266,700 | $132,100 | $134,600 |
| 2018 | $14,463 | $266,700 | $132,100 | $134,600 |
| 2017 | $14,306 | $266,700 | $132,100 | $134,600 |
| 2016 | $14,028 | $266,700 | $132,100 | $134,600 |
| 2015 | $13,892 | $266,700 | $132,100 | $134,600 |
| 2014 | $13,607 | $266,700 | $132,100 | $134,600 |
Source: Public Records
Map
Nearby Homes
- 39 Daniels Dr
- 34 Carline Dr
- 70 Anderson Dr
- 167 Rolling Hills Rd
- 123 Alexander Ave
- 15 Twain St
- 50 Edwards Rd
- 15 Carol Place
- 7 Nassau Rd
- 77 Huemmer Terrace
- 1283 Valley Rd Unit 7
- 1243 Valley Rd
- 1552 Broad St Rear
- 68 Doherty Dr
- 54 Doherty Dr
- 605 Grove St Unit 4
- 605 Grove St Unit 11
- 40 Greenview Way
- 18 Roy Ct