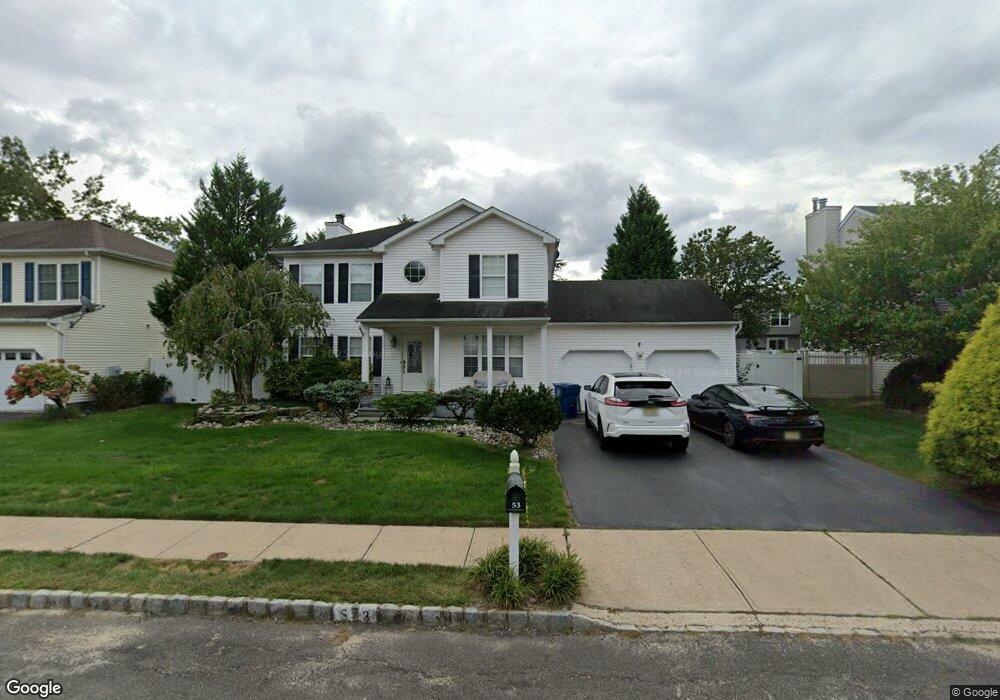
53 Diamond Ln Howell, NJ 07731
Salem Hill NeighborhoodEstimated Value: $720,524 - $760,000
3
Beds
2
Baths
1,872
Sq Ft
$397/Sq Ft
Est. Value
About This Home
This home is located at 53 Diamond Ln, Howell, NJ 07731 and is currently estimated at $742,631, approximately $396 per square foot. 53 Diamond Ln is a home located in Monmouth County with nearby schools including Land O' Pines School, Newbury School, and Howell Middle School North.
Ownership History
Date
Name
Owned For
Owner Type
Purchase Details
Closed on
Jun 30, 2004
Sold by
Mckinney Donald
Bought by
Mckinney Gwendolyn and Kelly Darlene
Current Estimated Value
Home Financials for this Owner
Home Financials are based on the most recent Mortgage that was taken out on this home.
Original Mortgage
$294,400
Outstanding Balance
$147,366
Interest Rate
6.25%
Estimated Equity
$595,265
Purchase Details
Closed on
Feb 27, 1996
Sold by
Mrc At Howell
Bought by
Mckinney Donald and Rogers Gwendoly
Home Financials for this Owner
Home Financials are based on the most recent Mortgage that was taken out on this home.
Original Mortgage
$157,000
Interest Rate
7.02%
Create a Home Valuation Report for This Property
The Home Valuation Report is an in-depth analysis detailing your home's value as well as a comparison with similar homes in the area
Home Values in the Area
Average Home Value in this Area
Purchase History
| Date | Buyer | Sale Price | Title Company |
|---|---|---|---|
| Mckinney Gwendolyn | $368,000 | -- | |
| Mckinney Donald | $173,900 | -- |
Source: Public Records
Mortgage History
| Date | Status | Borrower | Loan Amount |
|---|---|---|---|
| Open | Mckinney Gwendolyn | $294,400 | |
| Previous Owner | Mckinney Donald | $157,000 |
Source: Public Records
Tax History
| Year | Tax Paid | Tax Assessment Tax Assessment Total Assessment is a certain percentage of the fair market value that is determined by local assessors to be the total taxable value of land and additions on the property. | Land | Improvement |
|---|---|---|---|---|
| 2025 | $10,625 | $652,800 | $369,000 | $283,800 |
| 2024 | $10,347 | $597,600 | $319,000 | $278,600 |
| 2023 | $10,347 | $556,000 | $284,000 | $272,000 |
| 2022 | $8,686 | $469,300 | $189,000 | $280,300 |
| 2021 | $8,686 | $378,300 | $129,000 | $249,300 |
| 2020 | $8,719 | $375,500 | $129,000 | $246,500 |
| 2019 | $8,785 | $371,300 | $129,000 | $242,300 |
| 2018 | $8,810 | $370,000 | $139,000 | $231,000 |
| 2017 | $8,808 | $365,800 | $139,000 | $226,800 |
| 2016 | $8,758 | $360,100 | $139,000 | $221,100 |
| 2015 | $8,283 | $337,100 | $119,000 | $218,100 |
| 2014 | $8,349 | $315,300 | $134,000 | $181,300 |
Source: Public Records
Map
Nearby Homes
- 42 Diamond Ln
- 47 Sun Hollow Rd
- 254 Aldrich Rd
- 133 Starlight Rd
- 7 Cherry Bend Dr
- 43 Darien Rd
- 2 Northgate Dr
- 2 Lyndon Ln
- 21 Christopher Dr
- 58 Danella Way
- 14 Maxim Rd
- 0 Windeler Rd Unit 22523932
- 28 Princeton Dr
- 4 Christopher Dr
- 9 Spruce Rd
- 18 Tasha Ln
- 31 Sweetbriar Trail
- 302 Princeton Dr
- 28 Salem Hill Rd
- 14 Kiwi Loop
Your Personal Tour Guide
Ask me questions while you tour the home.