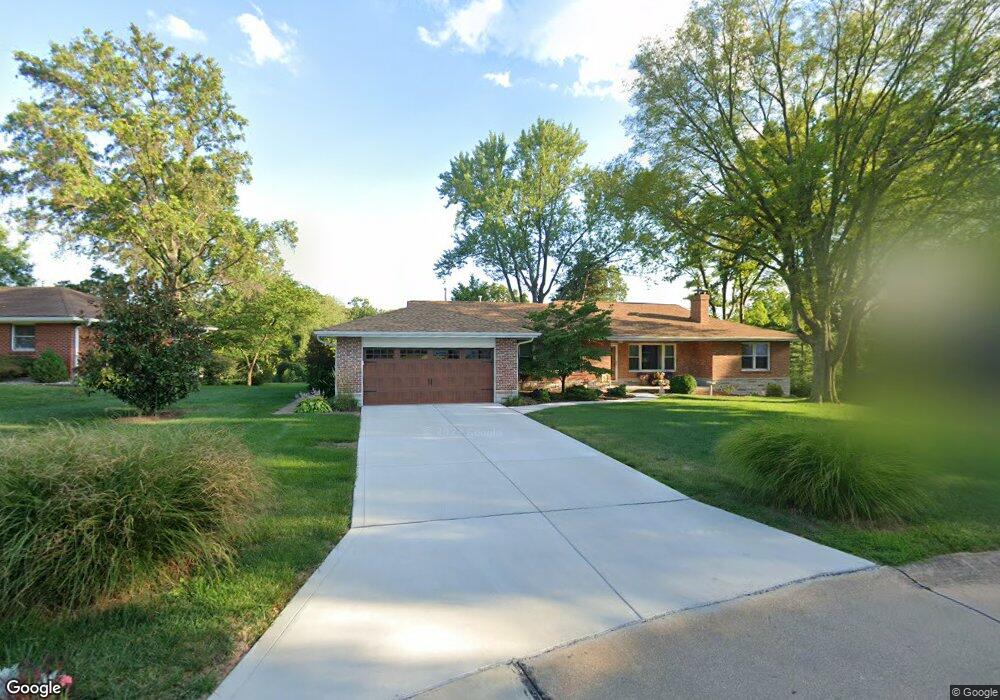
53 Dorclin Ln Saint Louis, MO 63128
Estimated Value: $494,000 - $568,000
3
Beds
3
Baths
2,602
Sq Ft
$197/Sq Ft
Est. Value
About This Home
This home is located at 53 Dorclin Ln, Saint Louis, MO 63128 and is currently estimated at $513,299, approximately $197 per square foot. 53 Dorclin Ln is a home located in St. Louis County with nearby schools including Sappington Elementary School, Sperreng Middle School, and Lindbergh High School.
Ownership History
Date
Name
Owned For
Owner Type
Purchase Details
Closed on
Feb 6, 2025
Sold by
Becker Richard A and Becker Linda M
Bought by
Richard A Becker And Linda M Becker Revocable and Becker
Current Estimated Value
Purchase Details
Closed on
Jan 8, 2004
Sold by
Sirva Relocation Llc
Bought by
Becker Richard A and Becker Linda M
Home Financials for this Owner
Home Financials are based on the most recent Mortgage that was taken out on this home.
Original Mortgage
$100,000
Interest Rate
5.79%
Mortgage Type
Purchase Money Mortgage
Purchase Details
Closed on
Jan 3, 2004
Sold by
Schulz Cory Michael and Schulz Deborah Ann Lind
Bought by
Sirva Relocation Llc
Home Financials for this Owner
Home Financials are based on the most recent Mortgage that was taken out on this home.
Original Mortgage
$100,000
Interest Rate
5.79%
Mortgage Type
Purchase Money Mortgage
Create a Home Valuation Report for This Property
The Home Valuation Report is an in-depth analysis detailing your home's value as well as a comparison with similar homes in the area
Home Values in the Area
Average Home Value in this Area
Purchase History
| Date | Buyer | Sale Price | Title Company |
|---|---|---|---|
| Richard A Becker And Linda M Becker Revocable | -- | None Listed On Document | |
| Becker Richard A | $325,000 | -- | |
| Sirva Relocation Llc | -- | -- |
Source: Public Records
Mortgage History
| Date | Status | Borrower | Loan Amount |
|---|---|---|---|
| Previous Owner | Becker Richard A | $100,000 |
Source: Public Records
Tax History Compared to Growth
Tax History
| Year | Tax Paid | Tax Assessment Tax Assessment Total Assessment is a certain percentage of the fair market value that is determined by local assessors to be the total taxable value of land and additions on the property. | Land | Improvement |
|---|---|---|---|---|
| 2025 | $4,660 | $94,130 | $25,330 | $68,800 |
| 2024 | $4,660 | $71,710 | $23,220 | $48,490 |
| 2023 | $4,660 | $71,710 | $23,220 | $48,490 |
| 2022 | $4,280 | $63,330 | $21,110 | $42,220 |
| 2021 | $4,127 | $63,330 | $21,110 | $42,220 |
| 2020 | $3,983 | $58,950 | $17,800 | $41,150 |
| 2019 | $3,973 | $58,950 | $17,800 | $41,150 |
| 2018 | $3,707 | $50,010 | $11,000 | $39,010 |
| 2017 | $3,666 | $50,010 | $11,000 | $39,010 |
| 2016 | $3,313 | $42,880 | $11,000 | $31,880 |
| 2015 | $3,263 | $42,880 | $11,000 | $31,880 |
| 2014 | $3,370 | $43,870 | $5,170 | $38,700 |
Source: Public Records
Map
Nearby Homes
- 25 Fawnwood Dr
- 5837 Oak Forest Ln
- 4838 Dorsie Dr
- 4849 Gatesbury Dr
- 11345 Revere Ln
- 11862 E Concord Rd
- 11673 Rossmoor Ln
- 4740 Hedgemont Dr
- 4931 Theiss Rd
- 12015 Charwick Dr
- 12055 Charwick Dr
- 4449 Pinyon Jay Ct
- 11542 Concord Village Ave
- 4829 Vermilion Dr
- 10916 Arctic Dr
- 10923 Suanis Ct
- 4700 Theiss Rd
- 11074 Kohrs Ln
- 9932 Jan Dr
- 4642 Theiss Rd