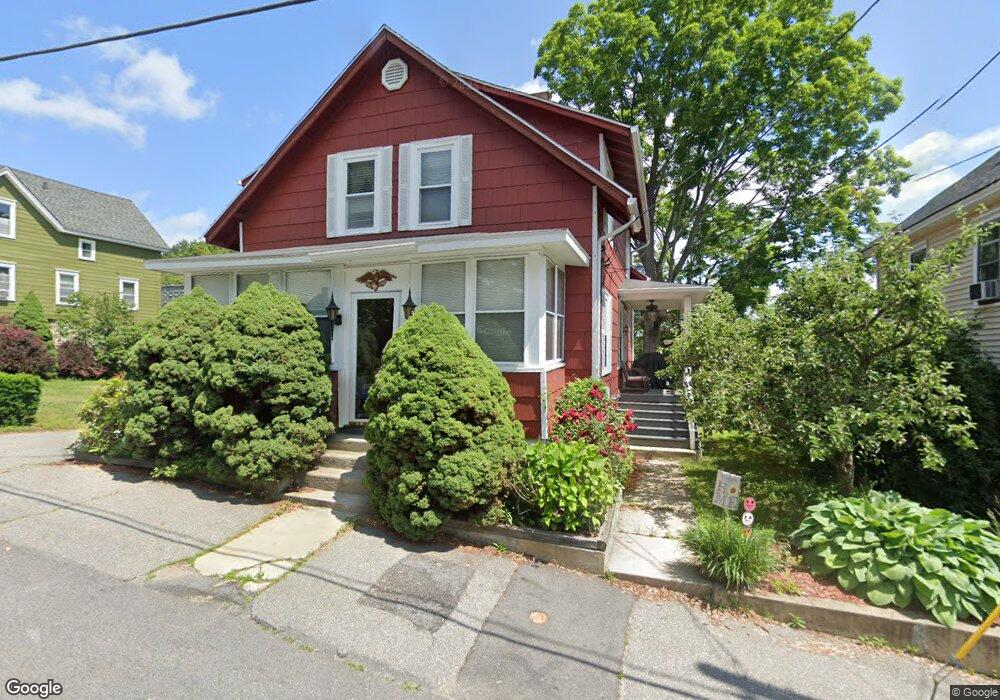
53 Dunfey St Lowell, MA 01854
Pawtucketville NeighborhoodEstimated Value: $499,000 - $641,000
4
Beds
1
Bath
1,700
Sq Ft
$328/Sq Ft
Est. Value
About This Home
This home is located at 53 Dunfey St, Lowell, MA 01854 and is currently estimated at $557,974, approximately $328 per square foot. 53 Dunfey St is a home located in Middlesex County with nearby schools including Joseph McAvinnue Elementary School, Charlotte M. Murkland Elementary School, and Charles W. Morey Elementary School.
Ownership History
Date
Name
Owned For
Owner Type
Purchase Details
Closed on
Jan 20, 2000
Sold by
Labonte Leo A
Bought by
Rocheleau Norman A and Rocheleau Susan F
Current Estimated Value
Home Financials for this Owner
Home Financials are based on the most recent Mortgage that was taken out on this home.
Original Mortgage
$95,000
Outstanding Balance
$30,184
Interest Rate
7.84%
Mortgage Type
Purchase Money Mortgage
Estimated Equity
$527,790
Create a Home Valuation Report for This Property
The Home Valuation Report is an in-depth analysis detailing your home's value as well as a comparison with similar homes in the area
Home Values in the Area
Average Home Value in this Area
Purchase History
| Date | Buyer | Sale Price | Title Company |
|---|---|---|---|
| Rocheleau Norman A | $147,000 | -- | |
| Rocheleau Norman A | $147,000 | -- |
Source: Public Records
Mortgage History
| Date | Status | Borrower | Loan Amount |
|---|---|---|---|
| Open | Rocheleau Norman A | $95,000 | |
| Closed | Rocheleau Norman A | $95,000 |
Source: Public Records
Tax History Compared to Growth
Tax History
| Year | Tax Paid | Tax Assessment Tax Assessment Total Assessment is a certain percentage of the fair market value that is determined by local assessors to be the total taxable value of land and additions on the property. | Land | Improvement |
|---|---|---|---|---|
| 2025 | $5,226 | $455,200 | $167,100 | $288,100 |
| 2024 | $4,838 | $406,200 | $134,700 | $271,500 |
| 2023 | $4,469 | $359,800 | $110,000 | $249,800 |
| 2022 | $4,167 | $328,400 | $97,400 | $231,000 |
| 2021 | $3,889 | $288,900 | $84,700 | $204,200 |
| 2020 | $4,056 | $303,600 | $109,600 | $194,000 |
| 2019 | $3,735 | $266,000 | $96,300 | $169,700 |
| 2018 | $3,651 | $253,700 | $91,700 | $162,000 |
| 2017 | $3,503 | $234,800 | $83,400 | $151,400 |
| 2016 | $3,143 | $207,300 | $81,100 | $126,200 |
| 2015 | $3,011 | $194,500 | $77,700 | $116,800 |
| 2013 | $2,831 | $188,600 | $85,800 | $102,800 |
Source: Public Records
Map
Nearby Homes