53 E Adams Dr East Saint Louis, IL 62206
Estimated Value: $64,000 - $83,433
--
Bed
--
Bath
925
Sq Ft
$83/Sq Ft
Est. Value
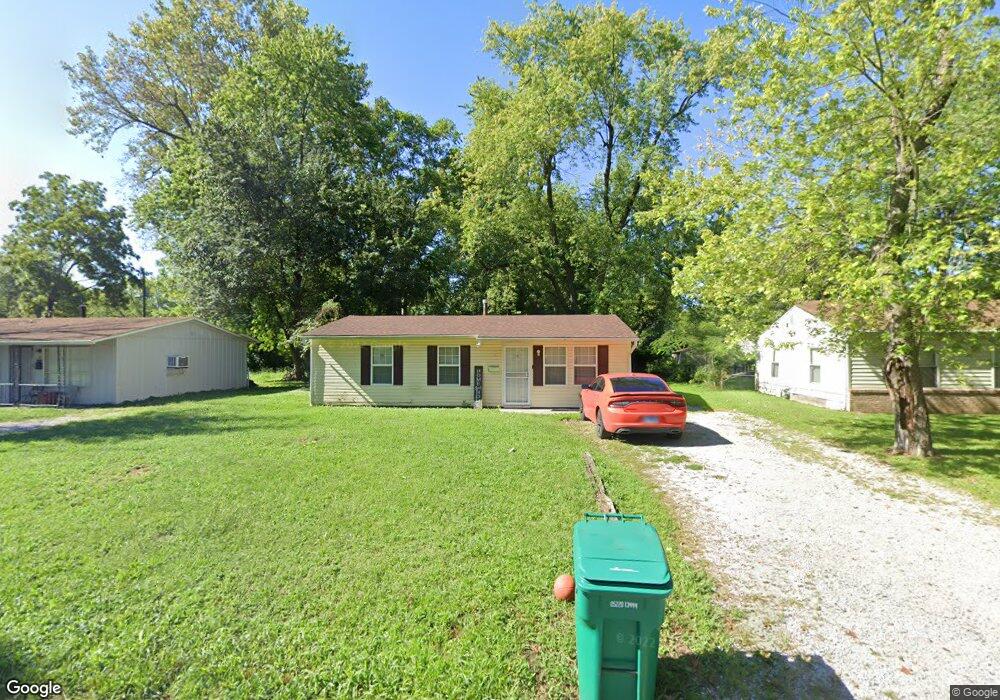
About This Home
This home is located at 53 E Adams Dr, East Saint Louis, IL 62206 and is currently estimated at $76,858, approximately $83 per square foot. 53 E Adams Dr is a home located in St. Clair County.
Ownership History
Date
Name
Owned For
Owner Type
Purchase Details
Closed on
Aug 24, 2013
Sold by
Sanders Jermone L and Sanders Jimmie L
Bought by
Sanders Jerome L and Sanders Jimmie L
Current Estimated Value
Home Financials for this Owner
Home Financials are based on the most recent Mortgage that was taken out on this home.
Original Mortgage
$48,525
Outstanding Balance
$12,155
Interest Rate
4.5%
Mortgage Type
New Conventional
Estimated Equity
$64,703
Purchase Details
Closed on
Apr 28, 2007
Sold by
Hsbc Mortgage Services Inc
Bought by
Sanders Jermone L and Sanders Jimmie L
Purchase Details
Closed on
Jun 28, 2006
Sold by
Holmon Dayrien T
Bought by
Hsbc Mortgage Services Inc
Create a Home Valuation Report for This Property
The Home Valuation Report is an in-depth analysis detailing your home's value as well as a comparison with similar homes in the area
Home Values in the Area
Average Home Value in this Area
Purchase History
| Date | Buyer | Sale Price | Title Company |
|---|---|---|---|
| Sanders Jerome L | -- | First American | |
| Sanders Jermone L | $16,000 | Forum Title Insurance Co | |
| Hsbc Mortgage Services Inc | -- | Wheatland Title |
Source: Public Records
Mortgage History
| Date | Status | Borrower | Loan Amount |
|---|---|---|---|
| Open | Sanders Jerome L | $48,525 |
Source: Public Records
Tax History Compared to Growth
Tax History
| Year | Tax Paid | Tax Assessment Tax Assessment Total Assessment is a certain percentage of the fair market value that is determined by local assessors to be the total taxable value of land and additions on the property. | Land | Improvement |
|---|---|---|---|---|
| 2024 | $1,802 | $9,418 | $1,371 | $8,047 |
| 2023 | $1,627 | $8,512 | $1,239 | $7,273 |
| 2022 | $1,484 | $7,460 | $1,086 | $6,374 |
| 2021 | $1,550 | $7,069 | $1,029 | $6,040 |
| 2020 | $1,664 | $7,007 | $1,078 | $5,929 |
| 2019 | $1,696 | $7,007 | $1,078 | $5,929 |
| 2018 | $1,687 | $7,110 | $1,094 | $6,016 |
| 2017 | $1,687 | $6,938 | $1,067 | $5,871 |
| 2016 | $1,775 | $6,913 | $1,063 | $5,850 |
| 2014 | $1,470 | $6,837 | $1,051 | $5,786 |
| 2013 | $1,351 | $6,413 | $986 | $5,427 |
Source: Public Records
Map
Nearby Homes