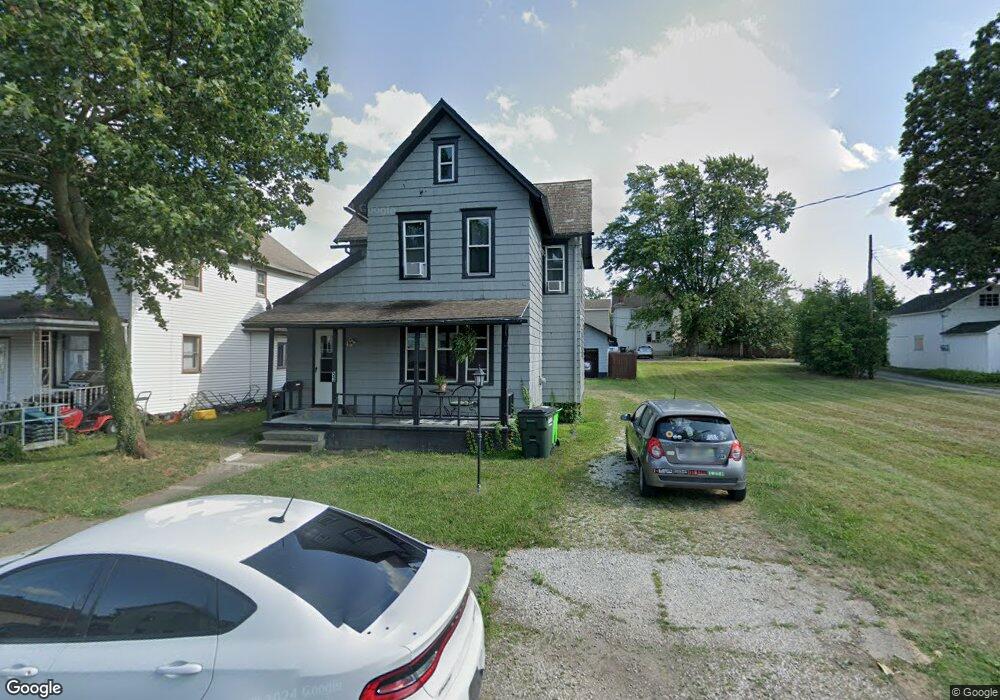
53 E High St Alliance, OH 44601
Estimated Value: $97,315 - $138,000
3
Beds
3
Baths
1,576
Sq Ft
$69/Sq Ft
Est. Value
About This Home
This home is located at 53 E High St, Alliance, OH 44601 and is currently estimated at $108,079, approximately $68 per square foot. 53 E High St is a home located in Stark County with nearby schools including Alliance Intermediate School at Northside, Alliance Elementary School at Rockhill, and Alliance Middle School.
Ownership History
Date
Name
Owned For
Owner Type
Purchase Details
Closed on
Mar 13, 2018
Sold by
Iagulli Henry and Iagulli Tonya
Bought by
Lmt Properties Inc
Current Estimated Value
Purchase Details
Closed on
Apr 21, 2010
Sold by
Lmt Properties Inc
Bought by
Iagulli Henry and Iagulli Tonya
Home Financials for this Owner
Home Financials are based on the most recent Mortgage that was taken out on this home.
Original Mortgage
$6,000
Interest Rate
8.5%
Mortgage Type
Seller Take Back
Purchase Details
Closed on
Sep 21, 2005
Sold by
Trummer Mitchell L and Trummer Lisa M
Bought by
Lmt Properties Inc
Purchase Details
Closed on
Oct 22, 2004
Sold by
Trummer William L and Trummer Janet D
Bought by
Trummer William L and Trummer Janet D
Home Financials for this Owner
Home Financials are based on the most recent Mortgage that was taken out on this home.
Original Mortgage
$25,000
Interest Rate
5.93%
Mortgage Type
Seller Take Back
Create a Home Valuation Report for This Property
The Home Valuation Report is an in-depth analysis detailing your home's value as well as a comparison with similar homes in the area
Home Values in the Area
Average Home Value in this Area
Purchase History
| Date | Buyer | Sale Price | Title Company |
|---|---|---|---|
| Lmt Properties Inc | -- | None Available | |
| Iagulli Henry | $65,000 | None Available | |
| Lmt Properties Inc | -- | -- | |
| Trummer William L | $63,000 | -- |
Source: Public Records
Mortgage History
| Date | Status | Borrower | Loan Amount |
|---|---|---|---|
| Previous Owner | Iagulli Henry | $6,000 | |
| Previous Owner | Trummer William L | $25,000 |
Source: Public Records
Tax History
| Year | Tax Paid | Tax Assessment Tax Assessment Total Assessment is a certain percentage of the fair market value that is determined by local assessors to be the total taxable value of land and additions on the property. | Land | Improvement |
|---|---|---|---|---|
| 2025 | -- | $20,200 | $3,920 | $16,280 |
| 2024 | -- | $20,200 | $3,920 | $16,280 |
| 2023 | $444 | $10,790 | $2,140 | $8,650 |
| 2022 | $447 | $10,790 | $2,140 | $8,650 |
| 2021 | $448 | $10,790 | $2,140 | $8,650 |
| 2020 | $418 | $9,390 | $1,860 | $7,530 |
| 2019 | $412 | $9,390 | $1,860 | $7,530 |
Source: Public Records
Map
Nearby Homes
- 62 E High St
- 0 E Oxford St
- 427 S Union Ave
- 62 E Market St
- 726 S Arch Ave
- 807 S Union Ave
- 228 W Oxford St
- 621 S Haines Ave
- 163 W Market St
- V/L S Freedom Ave
- 361 E Main St
- 452 E Summit St
- 46 Rosenberry St
- 171 1/2 W Main St
- 234 Rosenberry St
- 264 W Market St
- 231 Rosenberry St
- 226 Milner St
- 203 Glamorgan St
- 442 S Liberty Ave
- 43 E High St
- 63 E High St
- 421 S Park Ave
- 405 South Park
- 405 S Park Ave
- 33 E High St
- 419 S Park Ave
- 50 E Oxford St
- 50 E High St
- 70 E Oxford St
- 68 E High St
- 410 S Park Ave
- 40 E High St
- 32 E High St
- 410-412 S Park Ave Unit 410 S. Park
- 410-412 S Park Ave Unit 412 S. Park
- 410-412 S Park Ave
- 331 S Park Ave
- 414 S Park Ave
- 406 S Union Ave
Your Personal Tour Guide
Ask me questions while you tour the home.