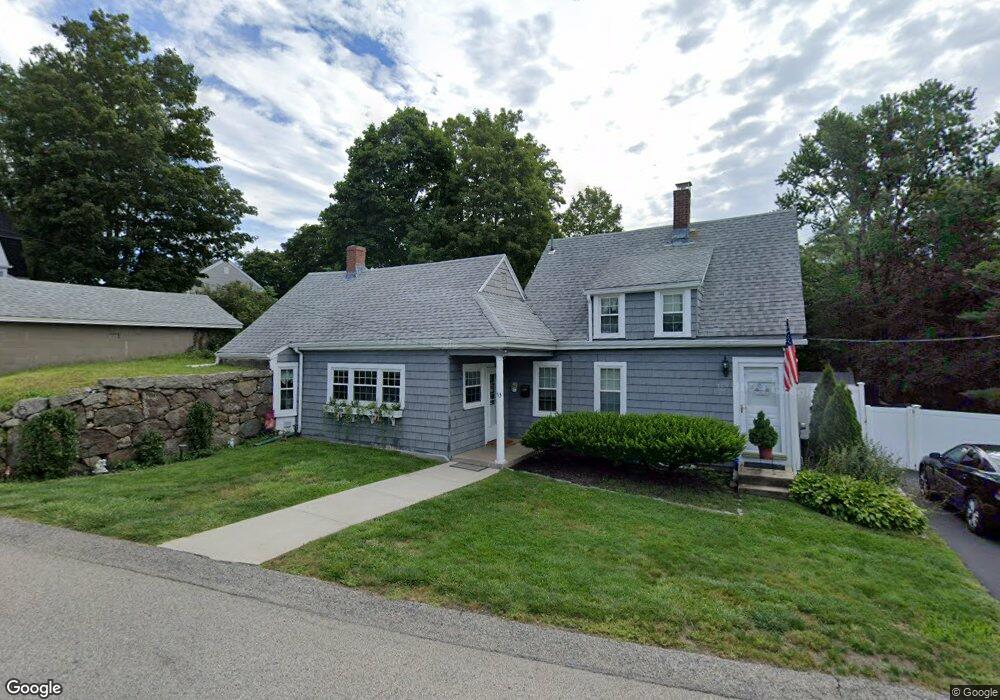
53 Elm St Abington, MA 02351
Estimated Value: $524,000 - $576,000
3
Beds
2
Baths
1,452
Sq Ft
$374/Sq Ft
Est. Value
About This Home
This home is located at 53 Elm St, Abington, MA 02351 and is currently estimated at $542,413, approximately $373 per square foot. 53 Elm St is a home located in Plymouth County with nearby schools including Beaver Brook Elementary School, Abington Middle School, and Woodsdale School.
Ownership History
Date
Name
Owned For
Owner Type
Purchase Details
Closed on
Nov 30, 2009
Sold by
Moran Victoria J and Kelly John C
Bought by
Scandura Stephanie and Mccaughin Daniel J
Current Estimated Value
Home Financials for this Owner
Home Financials are based on the most recent Mortgage that was taken out on this home.
Original Mortgage
$218,762
Outstanding Balance
$142,836
Interest Rate
4.92%
Mortgage Type
Purchase Money Mortgage
Estimated Equity
$399,577
Purchase Details
Closed on
Mar 25, 1988
Sold by
Farnsworth Barry C
Bought by
Moran Victoria J
Home Financials for this Owner
Home Financials are based on the most recent Mortgage that was taken out on this home.
Original Mortgage
$103,800
Interest Rate
9.82%
Mortgage Type
Purchase Money Mortgage
Create a Home Valuation Report for This Property
The Home Valuation Report is an in-depth analysis detailing your home's value as well as a comparison with similar homes in the area
Home Values in the Area
Average Home Value in this Area
Purchase History
| Date | Buyer | Sale Price | Title Company |
|---|---|---|---|
| Scandura Stephanie | $240,000 | -- | |
| Scandura Stephanie | $240,000 | -- | |
| Moran Victoria J | $131,000 | -- |
Source: Public Records
Mortgage History
| Date | Status | Borrower | Loan Amount |
|---|---|---|---|
| Open | Moran Victoria J | $218,762 | |
| Closed | Moran Victoria J | $218,762 | |
| Previous Owner | Moran Victoria J | $140,000 | |
| Previous Owner | Moran Victoria J | $103,800 |
Source: Public Records
Tax History Compared to Growth
Tax History
| Year | Tax Paid | Tax Assessment Tax Assessment Total Assessment is a certain percentage of the fair market value that is determined by local assessors to be the total taxable value of land and additions on the property. | Land | Improvement |
|---|---|---|---|---|
| 2025 | $5,664 | $433,700 | $245,600 | $188,100 |
| 2024 | $5,543 | $414,300 | $223,900 | $190,400 |
| 2023 | $5,451 | $383,600 | $195,500 | $188,100 |
| 2022 | $5,249 | $344,900 | $171,900 | $173,000 |
| 2021 | $4,916 | $298,300 | $156,500 | $141,800 |
| 2020 | $4,993 | $293,700 | $151,900 | $141,800 |
| 2019 | $4,669 | $268,500 | $145,000 | $123,500 |
| 2018 | $12,384 | $259,500 | $145,000 | $114,500 |
| 2017 | $4,406 | $240,100 | $145,000 | $95,100 |
| 2016 | $4,187 | $233,500 | $138,400 | $95,100 |
| 2015 | $3,964 | $233,200 | $138,400 | $94,800 |
Source: Public Records
Map
Nearby Homes
- 40 Bedford St
- 37 Rockland St
- 10 Bank St
- 87 Summer St
- 257 Rockland St Unit 257
- 89 Andrew Ford Way
- 133 Andrew Ford Way
- 333 Groveland St
- 34 George h Gillespie Way
- 116 Hancock St
- 1098 Bedford St
- 164 Hancock St
- 360 High St
- 209 Hancock St
- 193 Linwood St
- 676 Bedford St
- 63 Rice St
- 14 Doris Dr
- 300 High St
- 63 Dewey Ave