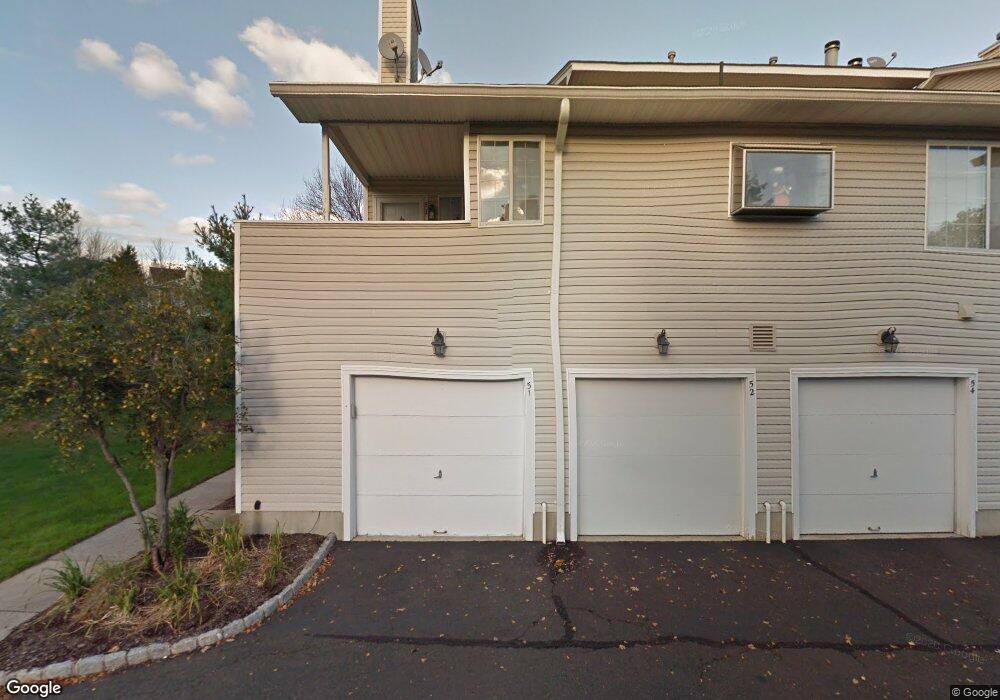
53 Encampment Dr Unit 753 Bedminster, NJ 07921
Estimated Value: $428,272 - $458,000
Studio
--
Bath
1,026
Sq Ft
$431/Sq Ft
Est. Value
About This Home
This home is located at 53 Encampment Dr Unit 753, Bedminster, NJ 07921 and is currently estimated at $442,568, approximately $431 per square foot. 53 Encampment Dr Unit 753 is a home located in Somerset County with nearby schools including Bedminster Township School and Guidepost Montessori at Bridgewater.
Ownership History
Date
Name
Owned For
Owner Type
Purchase Details
Closed on
Aug 24, 2007
Sold by
Foultz Jason and Foultz Laney
Bought by
Corvino Chris
Current Estimated Value
Home Financials for this Owner
Home Financials are based on the most recent Mortgage that was taken out on this home.
Original Mortgage
$246,000
Outstanding Balance
$156,153
Interest Rate
6.71%
Mortgage Type
Purchase Money Mortgage
Estimated Equity
$286,416
Purchase Details
Closed on
Feb 28, 2003
Sold by
Marcella Fernando
Bought by
Foultz Jason and Laney Jordan
Home Financials for this Owner
Home Financials are based on the most recent Mortgage that was taken out on this home.
Original Mortgage
$248,535
Interest Rate
5.95%
Mortgage Type
FHA
Purchase Details
Closed on
Mar 31, 1999
Sold by
Chu Dave
Bought by
Mnarcella Fernando and Abruzzo Deyanna
Home Financials for this Owner
Home Financials are based on the most recent Mortgage that was taken out on this home.
Original Mortgage
$139,500
Interest Rate
6.83%
Create a Home Valuation Report for This Property
The Home Valuation Report is an in-depth analysis detailing your home's value as well as a comparison with similar homes in the area
Home Values in the Area
Average Home Value in this Area
Purchase History
| Date | Buyer | Sale Price | Title Company |
|---|---|---|---|
| Corvino Chris | $307,500 | Stewart Title Guaranty Compa | |
| Foultz Jason | $250,500 | -- | |
| Mnarcella Fernando | $155,000 | -- |
Source: Public Records
Mortgage History
| Date | Status | Borrower | Loan Amount |
|---|---|---|---|
| Open | Corvino Chris | $246,000 | |
| Previous Owner | Foultz Jason | $248,535 | |
| Previous Owner | Mnarcella Fernando | $139,500 |
Source: Public Records
Tax History
| Year | Tax Paid | Tax Assessment Tax Assessment Total Assessment is a certain percentage of the fair market value that is determined by local assessors to be the total taxable value of land and additions on the property. | Land | Improvement |
|---|---|---|---|---|
| 2025 | $4,500 | $377,200 | $215,300 | $161,900 |
| 2024 | $4,500 | $354,300 | $203,100 | $151,200 |
Source: Public Records
Map
Nearby Homes
- 64 Encampment Dr
- 48 Morgan Ct
- 74 Academy Ct
- 85 Encampment Dr
- 14 Tory Ct
- 9 Hartley Ln
- 47 Gatehouse Rd
- 10 Hamilton Rd
- 22 Stone Run Rd
- 1 Tartan Dr
- 80 N Edgewood Rd
- 42 Fieldstone Rd
- 21 Stone Run Rd
- 19 Birchwood Rd
- 25 Crestmont Rd Unit 6225
- 18 Birchwood Rd Unit 6018
- 47 Spruce Ct
- 55 Sage Ct
- 21 Dorchester Dr
- 11 Mountain Ct
- 56 Encampment Dr
- 55 Encampment Dr
- 58 Encampment Dr Unit 758
- 54 Encampment Dr
- 51 Encampment Dr
- 57 Encampment Dr
- 52 Encampment Dr
- 60 Encampment Dr
- 59 Encampment Dr
- 34 Academy Ct Unit 1634
- 48 Encampment Dr
- 50 Encampment Dr
- 50 Encampment Drive Ondo
- 49 Encampment Dr Unit 649
- 46 Encampment Dr
- 32 Academy Ct
- 35 Academy Ct
- 61 Encampment Drive Ondo
- 1 Quincy Ct
- 31 Academy Ct
Your Personal Tour Guide
Ask me questions while you tour the home.