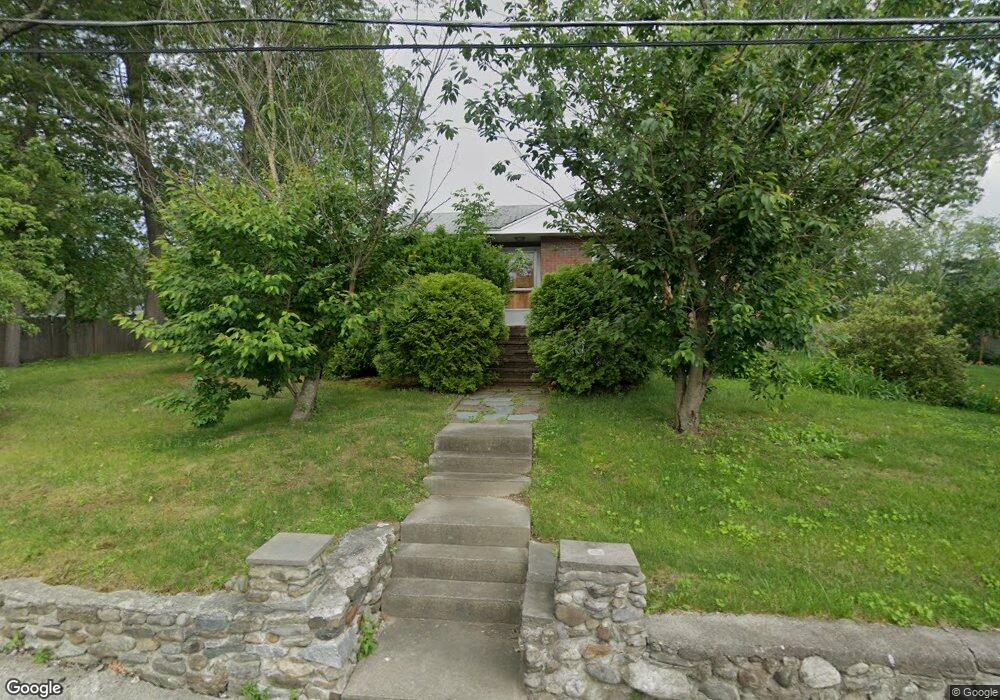
53 F St Dracut, MA 01826
Estimated Value: $466,000 - $534,296
3
Beds
2
Baths
1,128
Sq Ft
$441/Sq Ft
Est. Value
About This Home
This home is located at 53 F St, Dracut, MA 01826 and is currently estimated at $497,824, approximately $441 per square foot. 53 F St is a home located in Middlesex County with nearby schools including Brookside Elementary School, Richardson Middle School, and Dracut Senior High School.
Ownership History
Date
Name
Owned For
Owner Type
Purchase Details
Closed on
Apr 25, 2019
Sold by
Pingel Stephen
Bought by
Conroy Claire M
Current Estimated Value
Home Financials for this Owner
Home Financials are based on the most recent Mortgage that was taken out on this home.
Original Mortgage
$442,500
Outstanding Balance
$437,675
Interest Rate
4%
Mortgage Type
Reverse Mortgage Home Equity Conversion Mortgage
Estimated Equity
$60,149
Purchase Details
Closed on
Jun 24, 2008
Sold by
Pingel Claire M and Conroy Marie E
Bought by
Pingel Claire M and Conroy Marie E
Create a Home Valuation Report for This Property
The Home Valuation Report is an in-depth analysis detailing your home's value as well as a comparison with similar homes in the area
Home Values in the Area
Average Home Value in this Area
Purchase History
| Date | Buyer | Sale Price | Title Company |
|---|---|---|---|
| Conroy Claire M | -- | -- | |
| Pingel Claire M | -- | -- |
Source: Public Records
Mortgage History
| Date | Status | Borrower | Loan Amount |
|---|---|---|---|
| Open | Conroy Claire M | $442,500 |
Source: Public Records
Tax History Compared to Growth
Tax History
| Year | Tax Paid | Tax Assessment Tax Assessment Total Assessment is a certain percentage of the fair market value that is determined by local assessors to be the total taxable value of land and additions on the property. | Land | Improvement |
|---|---|---|---|---|
| 2025 | $4,498 | $444,500 | $199,200 | $245,300 |
| 2024 | $4,477 | $428,400 | $189,700 | $238,700 |
| 2023 | $4,289 | $370,400 | $165,000 | $205,400 |
| 2022 | $4,188 | $340,800 | $149,900 | $190,900 |
| 2021 | $4,044 | $310,800 | $136,300 | $174,500 |
| 2020 | $3,892 | $291,500 | $132,300 | $159,200 |
| 2019 | $3,791 | $275,700 | $125,900 | $149,800 |
| 2018 | $3,696 | $261,400 | $125,900 | $135,500 |
| 2017 | $3,587 | $261,400 | $125,900 | $135,500 |
| 2016 | $3,443 | $232,000 | $121,100 | $110,900 |
| 2015 | $3,341 | $223,800 | $121,100 | $102,700 |
| 2014 | $3,124 | $215,600 | $121,100 | $94,500 |
Source: Public Records
Map
Nearby Homes