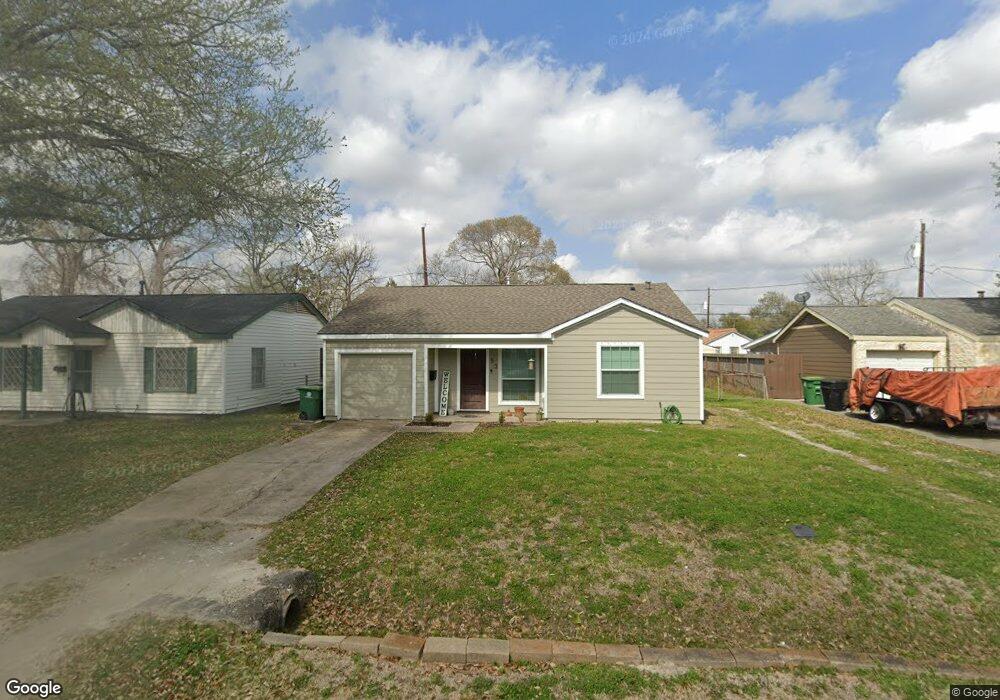
53 Farrell St Houston, TX 77022
Northside-Northline NeighborhoodEstimated Value: $179,297 - $222,000
2
Beds
1
Bath
948
Sq Ft
$215/Sq Ft
Est. Value
About This Home
This home is located at 53 Farrell St, Houston, TX 77022 and is currently estimated at $203,824, approximately $215 per square foot. 53 Farrell St is a home located in Harris County with nearby schools including Burbank Elementary School, Burbank Middle School, and Sam Houston Math, Science & Technology Center.
Ownership History
Date
Name
Owned For
Owner Type
Purchase Details
Closed on
Oct 9, 2014
Sold by
Vincent Buddy Joe
Bought by
Thorn Jennings Tamara
Current Estimated Value
Create a Home Valuation Report for This Property
The Home Valuation Report is an in-depth analysis detailing your home's value as well as a comparison with similar homes in the area
Home Values in the Area
Average Home Value in this Area
Purchase History
| Date | Buyer | Sale Price | Title Company |
|---|---|---|---|
| Thorn Jennings Tamara | -- | Northstar Title Co | |
| Jennings Tamara Thorn | -- | North Star Title Co | |
| Thorn Jennings Tamara | -- | North Star Title Co |
Source: Public Records
Tax History Compared to Growth
Tax History
| Year | Tax Paid | Tax Assessment Tax Assessment Total Assessment is a certain percentage of the fair market value that is determined by local assessors to be the total taxable value of land and additions on the property. | Land | Improvement |
|---|---|---|---|---|
| 2025 | $4,633 | $221,444 | $62,948 | $158,496 |
| 2024 | $4,633 | $221,444 | $62,948 | $158,496 |
| 2023 | $4,004 | $198,744 | $62,948 | $135,796 |
| 2022 | $3,536 | $160,588 | $47,960 | $112,628 |
| 2021 | $3,583 | $153,726 | $47,960 | $105,766 |
| 2020 | $2,145 | $88,570 | $47,960 | $40,610 |
| 2019 | $1,824 | $72,084 | $31,474 | $40,610 |
| 2018 | $1,544 | $61,000 | $31,474 | $29,526 |
| 2017 | $1,542 | $61,000 | $31,474 | $29,526 |
| 2016 | $1,542 | $61,000 | $31,474 | $29,526 |
| 2015 | $1,516 | $58,970 | $31,474 | $27,496 |
| 2014 | $1,516 | $58,970 | $31,474 | $27,496 |
Source: Public Records
Map
Nearby Homes
- 70 Burress St
- 44 Farrell St
- 61 Trenwood Ln
- 90 Burress St Unit B
- 90 Burress St Unit A
- 45 Wellford St
- 56 Wellford St
- 108 Fichter St
- Cypress Plan at Wellford Village
- Willow Plan at Wellford Village
- 132 Grothe Ln
- 216 Burress St
- 249 De Boll St
- 253 De Boll St
- 9625 Fulton St
- 91 Burbank St
- 0 Burbank St Unit 9886770
- 318 Charlock St
- 202 Burbank St
- 106 Luetta St