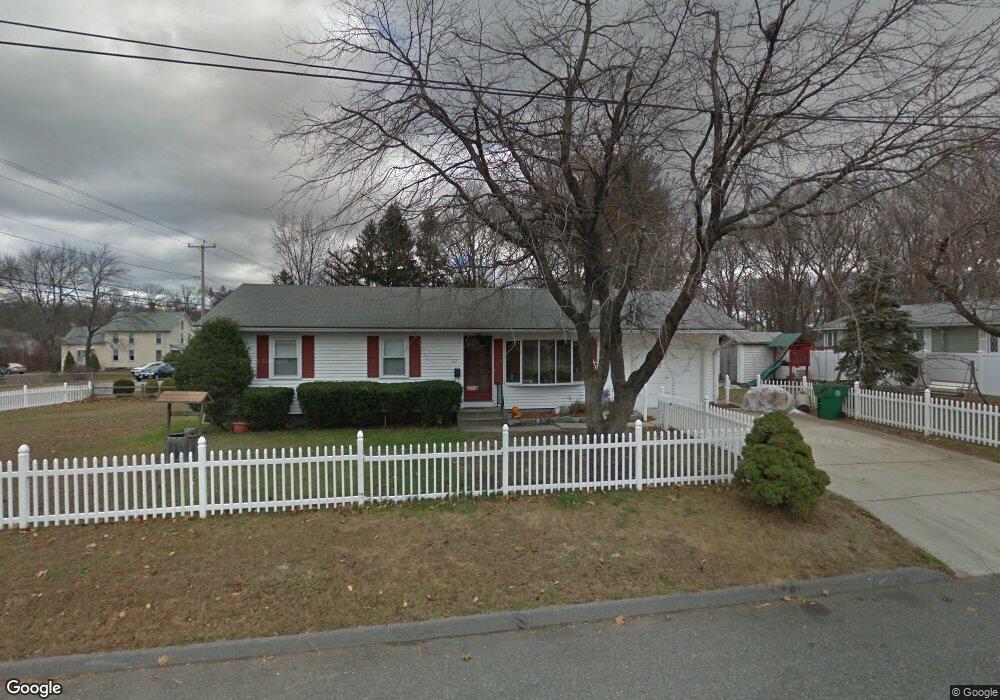
53 Fillmore St Chicopee, MA 01020
Fairview NeighborhoodEstimated Value: $323,352 - $365,000
3
Beds
1
Bath
1,008
Sq Ft
$340/Sq Ft
Est. Value
About This Home
This home is located at 53 Fillmore St, Chicopee, MA 01020 and is currently estimated at $343,088, approximately $340 per square foot. 53 Fillmore St is a home located in Hampden County with nearby schools including Bowie Elementary School, Fairview Middle School, and Chicopee Comprehensive High School.
Ownership History
Date
Name
Owned For
Owner Type
Purchase Details
Closed on
May 23, 2017
Sold by
Walewski Lester P
Bought by
Walewski Anna D
Current Estimated Value
Purchase Details
Closed on
Nov 21, 2002
Sold by
Beaudoin Ethel G and Beaudoin Ethel P
Bought by
Walewski Lester P and Walewski Anna D
Home Financials for this Owner
Home Financials are based on the most recent Mortgage that was taken out on this home.
Original Mortgage
$95,000
Interest Rate
6.07%
Mortgage Type
Purchase Money Mortgage
Create a Home Valuation Report for This Property
The Home Valuation Report is an in-depth analysis detailing your home's value as well as a comparison with similar homes in the area
Home Values in the Area
Average Home Value in this Area
Purchase History
| Date | Buyer | Sale Price | Title Company |
|---|---|---|---|
| Walewski Anna D | -- | -- | |
| Walewski Lester P | $133,600 | -- |
Source: Public Records
Mortgage History
| Date | Status | Borrower | Loan Amount |
|---|---|---|---|
| Previous Owner | Walewski Lester P | $95,000 |
Source: Public Records
Tax History Compared to Growth
Tax History
| Year | Tax Paid | Tax Assessment Tax Assessment Total Assessment is a certain percentage of the fair market value that is determined by local assessors to be the total taxable value of land and additions on the property. | Land | Improvement |
|---|---|---|---|---|
| 2025 | $4,221 | $278,400 | $111,300 | $167,100 |
| 2024 | $4,006 | $271,400 | $109,100 | $162,300 |
| 2023 | $3,784 | $249,800 | $99,100 | $150,700 |
| 2022 | $3,622 | $213,200 | $86,200 | $127,000 |
| 2021 | $3,439 | $195,300 | $78,300 | $117,000 |
| 2020 | $3,317 | $190,000 | $80,500 | $109,500 |
| 2019 | $3,278 | $182,500 | $80,500 | $102,000 |
| 2018 | $3,219 | $175,800 | $76,600 | $99,200 |
| 2017 | $3,003 | $173,500 | $70,300 | $103,200 |
| 2016 | $2,772 | $163,900 | $70,300 | $93,600 |
| 2015 | $2,929 | $167,000 | $70,300 | $96,700 |
| 2014 | $1,465 | $167,000 | $70,300 | $96,700 |
Source: Public Records
Map
Nearby Homes
- LOT B Old Fuller Rd
- lot 0 Harding St
- LOT 6 Lariviere Dr
- LOT B Old Fuller rd Extension
- LOT 5 Fuller Rd
- LOT D Coolidge
- LOT C Gardner
- L12&13 Marble Ave
- LOT 13 Gaspee St
- LOT A Irene St
- PARCEL A Oldfield Rd
- LOT 1 Anson St
- LOTS 508-10 Blanchwood Ave
- LOT B Sanders St
- L-15 Lariviere
- LOT 72 Ludger Ave
- B Walsh St
- - Anson St
- LOT 18 Granby Rd
- LOT 8 Cyran