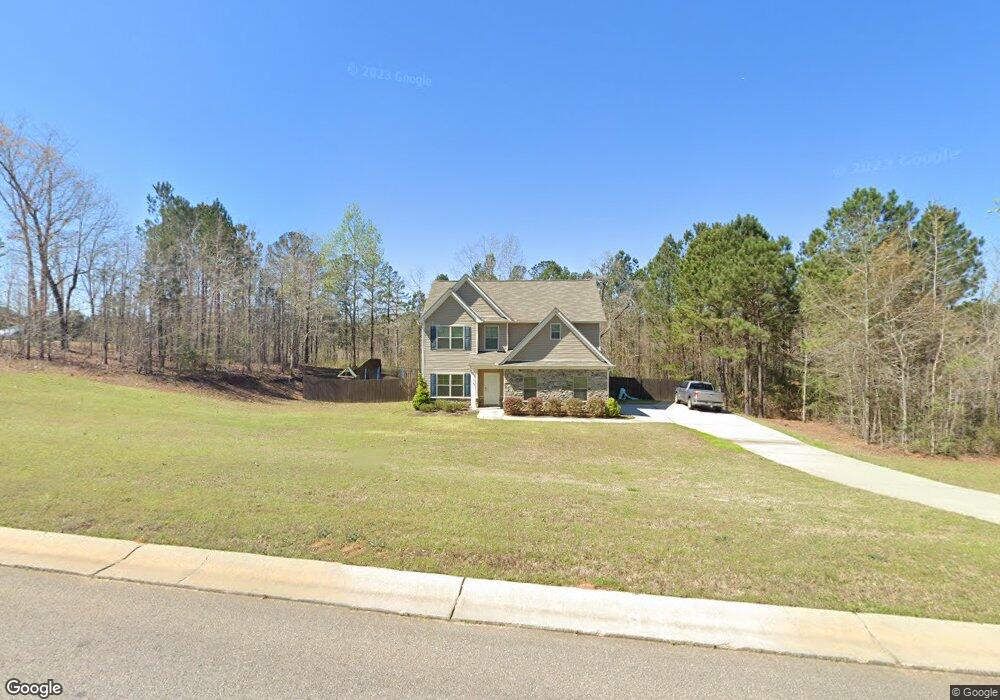
53 Flatcreek Dr Lagrange, GA 30241
Estimated Value: $305,457 - $367,000
5
Beds
3
Baths
2,284
Sq Ft
$147/Sq Ft
Est. Value
About This Home
This home is located at 53 Flatcreek Dr, Lagrange, GA 30241 and is currently estimated at $335,364, approximately $146 per square foot. 53 Flatcreek Dr is a home located in Troup County with nearby schools including Franklin Forest Elementary School, Hollis Hand Elementary School, and Ethel W. Kight Elementary School.
Ownership History
Date
Name
Owned For
Owner Type
Purchase Details
Closed on
Sep 25, 2020
Sold by
Brown Jonathan Keith
Bought by
Pedersen Brian
Current Estimated Value
Home Financials for this Owner
Home Financials are based on the most recent Mortgage that was taken out on this home.
Original Mortgage
$234,778
Outstanding Balance
$207,401
Interest Rate
2.9%
Mortgage Type
VA
Estimated Equity
$127,963
Purchase Details
Closed on
Jul 10, 2018
Sold by
Freedom Builders Inc
Bought by
Brown Jonathan Keith and Brown Hailey Rae
Home Financials for this Owner
Home Financials are based on the most recent Mortgage that was taken out on this home.
Original Mortgage
$172,020
Interest Rate
4.6%
Mortgage Type
New Conventional
Purchase Details
Closed on
Sep 29, 2016
Bought by
Freedom Builders Inc
Home Financials for this Owner
Home Financials are based on the most recent Mortgage that was taken out on this home.
Original Mortgage
$145,500
Interest Rate
3.46%
Mortgage Type
Purchase Money Mortgage
Create a Home Valuation Report for This Property
The Home Valuation Report is an in-depth analysis detailing your home's value as well as a comparison with similar homes in the area
Purchase History
| Date | Buyer | Sale Price | Title Company |
|---|---|---|---|
| Pedersen Brian | $229,500 | -- | |
| Brown Jonathan Keith | $215,025 | -- | |
| Freedom Builders Inc | $40,000 | -- |
Source: Public Records
Mortgage History
| Date | Status | Borrower | Loan Amount |
|---|---|---|---|
| Open | Pedersen Brian | $234,778 | |
| Previous Owner | Brown Jonathan Keith | $172,020 | |
| Previous Owner | Freedom Builders Inc | $145,500 |
Source: Public Records
Tax History
| Year | Tax Paid | Tax Assessment Tax Assessment Total Assessment is a certain percentage of the fair market value that is determined by local assessors to be the total taxable value of land and additions on the property. | Land | Improvement |
|---|---|---|---|---|
| 2025 | $3,219 | $118,040 | $14,000 | $104,040 |
| 2024 | $2,736 | $100,320 | $14,000 | $86,320 |
| 2023 | $2,717 | $99,640 | $14,000 | $85,640 |
| 2022 | $2,478 | $88,800 | $10,000 | $78,800 |
| 2021 | $2,634 | $87,320 | $18,000 | $69,320 |
| 2020 | $2,634 | $87,320 | $18,000 | $69,320 |
| 2019 | $2,594 | $87,960 | $10,000 | $77,960 |
| 2018 | $2,438 | $80,840 | $8,000 | $72,840 |
| 2017 | $241 | $8,000 | $8,000 | $0 |
Source: Public Records
Map
Nearby Homes
- 119 Sir Lancelot St
- 124 Woodridge Cir
- 200 Freshwater Ct Unit 37
- 402 Sweetwood Ct Unit LOT 2
- 202 Freshwater Ct Unit E36
- 202 Freshwater Ct
- 234 River Meadow Dr
- 204 Freshwater Ct
- 206 Freshwater Ct Unit 34E
- 206 Freshwater Ct
- 124 Shenandoah Ln
- 114 Shenandoah Ln
- 106 Shenandoah Ln Unit 26E
- 106 Shenandoah Ln
- 200 River Meadow Dr
- 108 Shenandoah Ln
- 108 Shenandoah Ln Unit 27E
- 117 Shenandoah Ln Unit 22D
- 136 Shenandoah Ln
- 300 Old Pond Rd
- 38 Flat Creek Dr Unit 40
- 64 Flat Creek Dr Unit 39
- 53 Flat Creek Dr Unit 3
- 17 Flat Creek Dr Unit 1
- 71 Flat Creek Dr Unit 4
- 90 Flat Creek Dr
- 53 Flat Creek Dr
- 71 Flat Creek Dr
- 71 Flatcreek Dr
- 38 Flatcreek Dr
- 16 Flatcreek Dr Unit Lot 41
- 35 Flatcreek Dr Unit Lot 2
- 89 Flat Creek Dr Unit Lot 5
- 17 Flat Creek Dr
- 90 Flat Creek Dr Unit Lot 38
- 180 Davis Rd
- 220 N Davis Rd
- 140 N Davis Rd
- 140 N Davis Rd Unit Lot 36
- 1515 Hogansville Rd
Your Personal Tour Guide
Ask me questions while you tour the home.