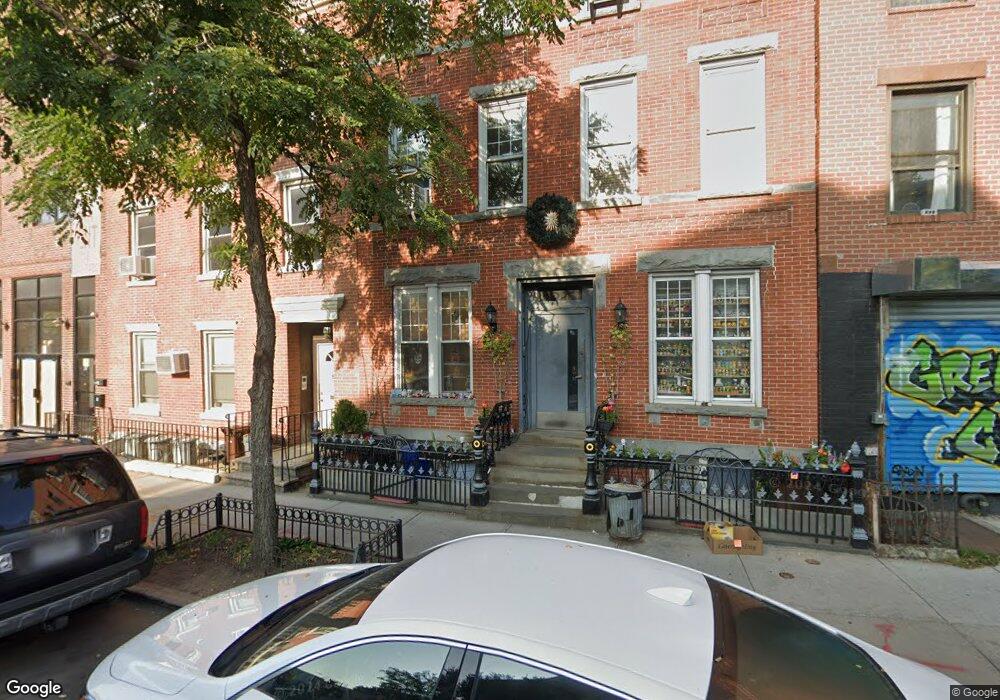
53 Franklin St Unit 59 Brooklyn, NY 11222
Greenpoint NeighborhoodEstimated Value: $655,379 - $1,727,000
Studio
--
Bath
1,101
Sq Ft
$1,101/Sq Ft
Est. Value
About This Home
This home is located at 53 Franklin St Unit 59, Brooklyn, NY 11222 and is currently estimated at $1,212,345, approximately $1,101 per square foot. 53 Franklin St Unit 59 is a home located in Kings County with nearby schools including P.S. 34 Oliver H Perry, Northside Charter High School, and Trilok School.
Ownership History
Date
Name
Owned For
Owner Type
Purchase Details
Closed on
Dec 16, 2025
Sold by
Joel Polatsek
Bought by
Aron Rothbart
Current Estimated Value
Purchase Details
Closed on
Oct 13, 2020
Sold by
Joel Polatsek As Trustee and The 53 Franklin Avenue Trust
Bought by
Polatsek Joel
Purchase Details
Closed on
Apr 12, 2016
Sold by
Schwartz As Trustee Rivka and The Acres Trust Dated 4-23-13
Bought by
Polatsek As Trustee Joel and The 53 Franklin Avenue Trust Dated 3-201
Purchase Details
Closed on
May 6, 2013
Sold by
Schwartz Rivka
Bought by
Schwartz Rivka As Trustee and The Acres Trust Dated April 23 2013
Purchase Details
Closed on
Oct 21, 2003
Sold by
Skillman St Realty
Bought by
Schwartz Rivka
Home Financials for this Owner
Home Financials are based on the most recent Mortgage that was taken out on this home.
Original Mortgage
$218,000
Interest Rate
5.67%
Mortgage Type
Purchase Money Mortgage
Create a Home Valuation Report for This Property
The Home Valuation Report is an in-depth analysis detailing your home's value as well as a comparison with similar homes in the area
Home Values in the Area
Average Home Value in this Area
Purchase History
| Date | Buyer | Sale Price | Title Company |
|---|---|---|---|
| Aron Rothbart | -- | Ts Agency | |
| Polatsek Joel | -- | -- | |
| Polatsek Joel | -- | -- | |
| Polatsek Joel | -- | -- | |
| Polatsek As Trustee Joel | -- | -- | |
| Polatsek As Trustee Joel | -- | -- | |
| Polatsek As Trustee Joel | -- | -- | |
| Schwartz Rivka As Trustee | -- | -- | |
| Schwartz Rivka As Trustee | -- | -- | |
| Schwartz Rivka | -- | -- | |
| Schwartz Rivka | -- | -- |
Source: Public Records
Mortgage History
| Date | Status | Borrower | Loan Amount |
|---|---|---|---|
| Previous Owner | Schwartz Rivka | $218,000 |
Source: Public Records
Tax History
| Year | Tax Paid | Tax Assessment Tax Assessment Total Assessment is a certain percentage of the fair market value that is determined by local assessors to be the total taxable value of land and additions on the property. | Land | Improvement |
|---|---|---|---|---|
| 2025 | $504 | $67,864 | $2,613 | $65,251 |
| 2024 | $504 | $64,422 | $2,613 | $61,809 |
| 2023 | $494 | $62,194 | $2,613 | $59,581 |
| 2022 | $493 | $53,955 | $2,613 | $51,342 |
| 2021 | $494 | $50,333 | $2,613 | $47,720 |
| 2020 | $503 | $58,545 | $2,613 | $55,932 |
| 2019 | $508 | $60,435 | $2,613 | $57,822 |
| 2018 | $513 | $50,333 | $2,613 | $47,720 |
| 2017 | $513 | $48,240 | $2,613 | $45,627 |
| 2016 | $520 | $46,013 | $2,614 | $43,399 |
| 2015 | -- | $32,108 | $2,614 | $29,494 |
| 2014 | -- | $30,533 | $2,613 | $27,920 |
Source: Public Records
Map
Nearby Homes
- 84 Oak St Unit 3-B
- 111 Calyer St
- 129 Calyer St
- 141 Calyer St
- 16 Clifford Place
- 1125 Lorimer St Unit 5H
- 171 Calyer St Unit 3 E
- 143 Milton St
- 1023 Lorimer St
- 122 West St Unit 2P
- 67 Norman Ave
- 120 Java St Unit 4-B
- 215 Calyer St Unit 1
- 215 Calyer St Unit 4
- 215 Calyer St Unit 2
- 269 Eckford St Unit 4A
- 269 Eckford St Unit 3A
- 186 Kent St
- 82 Guernsey St Unit 2-A
- 81 India St Unit 4A
- 53 Franklin St Unit 1B
- 53 Franklin St
- 53 Franklin St Unit 8A
- 53 Franklin St Unit 9B
- 53 Franklin St Unit 5A
- 53 Franklin St Unit 2A
- 53 Franklin St Unit 8B
- 53 Franklin St Unit S2A
- 53 Franklin St Unit 4B
- 53 Franklin St Unit 5B
- 53 Franklin St Unit 9A
- 53 Franklin St Unit 4A
- 53 Franklin St Unit 1A
- 53 Franklin St Unit S1A
- 53 Franklin St Unit 7B
- 53 Franklin St Unit S1B
- 53 Franklin St Unit 6B
- 53 Franklin St Unit 10A
- 53 Franklin St Unit 7A
- 53 Franklin St Unit 3B
Your Personal Tour Guide
Ask me questions while you tour the home.