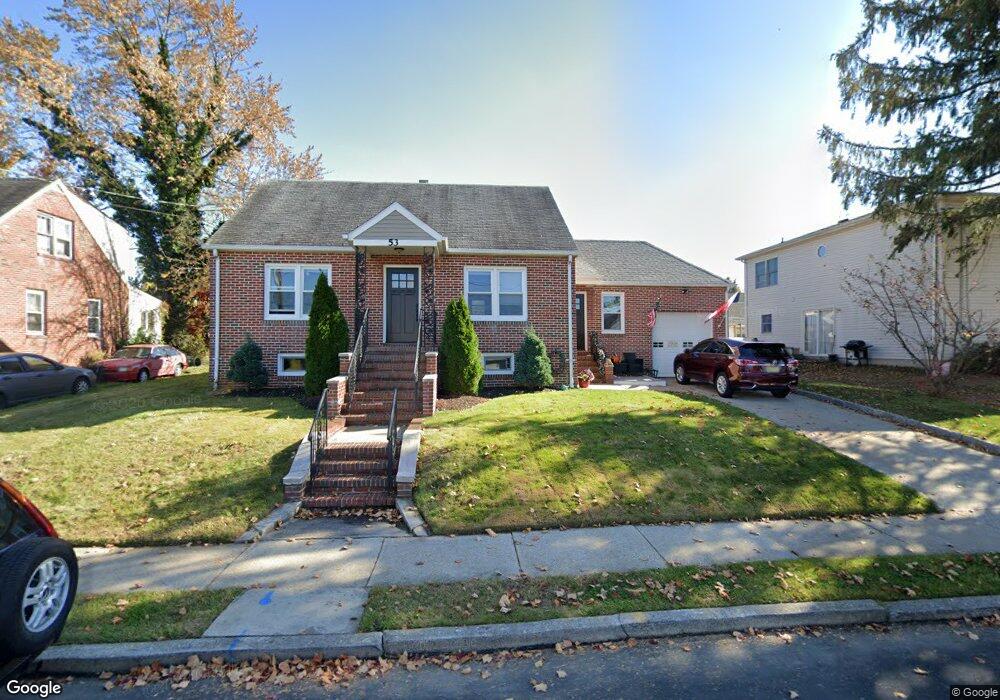
53 Garwood St South River, NJ 08882
Estimated Value: $460,000 - $549,000
2
Beds
2
Baths
1,583
Sq Ft
$319/Sq Ft
Est. Value
About This Home
This home is located at 53 Garwood St, South River, NJ 08882 and is currently estimated at $505,353, approximately $319 per square foot. 53 Garwood St is a home located in Middlesex County with nearby schools including South River Primary School, South River Elementary School, and South River Middle School.
Ownership History
Date
Name
Owned For
Owner Type
Purchase Details
Closed on
Sep 29, 2013
Sold by
Csabay Louis
Bought by
Zielinski Tomasz and Zielinski Katarzyna
Current Estimated Value
Home Financials for this Owner
Home Financials are based on the most recent Mortgage that was taken out on this home.
Original Mortgage
$214,050
Outstanding Balance
$161,589
Interest Rate
4.62%
Mortgage Type
FHA
Estimated Equity
$343,764
Purchase Details
Closed on
Nov 17, 2010
Sold by
Csabay Louis
Bought by
Csabay Anne C
Create a Home Valuation Report for This Property
The Home Valuation Report is an in-depth analysis detailing your home's value as well as a comparison with similar homes in the area
Home Values in the Area
Average Home Value in this Area
Purchase History
| Date | Buyer | Sale Price | Title Company |
|---|---|---|---|
| Zielinski Tomasz | $218,000 | Wfg National Title Insurance | |
| Csabay Anne C | -- | None Available |
Source: Public Records
Mortgage History
| Date | Status | Borrower | Loan Amount |
|---|---|---|---|
| Open | Zielinski Tomasz | $214,050 |
Source: Public Records
Tax History Compared to Growth
Tax History
| Year | Tax Paid | Tax Assessment Tax Assessment Total Assessment is a certain percentage of the fair market value that is determined by local assessors to be the total taxable value of land and additions on the property. | Land | Improvement |
|---|---|---|---|---|
| 2025 | $7,318 | $287,300 | $147,500 | $139,800 |
| 2024 | $7,099 | $287,300 | $147,500 | $139,800 |
| 2023 | $7,099 | $287,300 | $147,500 | $139,800 |
| 2022 | $6,976 | $287,300 | $147,500 | $139,800 |
| 2021 | $5,000 | $287,300 | $147,500 | $139,800 |
| 2020 | $6,571 | $287,300 | $147,500 | $139,800 |
| 2019 | $6,614 | $80,300 | $24,100 | $56,200 |
| 2018 | $6,455 | $80,300 | $24,100 | $56,200 |
| 2017 | $6,219 | $80,300 | $24,100 | $56,200 |
| 2016 | $5,984 | $80,300 | $24,100 | $56,200 |
| 2015 | $5,850 | $80,300 | $24,100 | $56,200 |
| 2014 | $5,716 | $80,300 | $24,100 | $56,200 |
Source: Public Records
Map
Nearby Homes