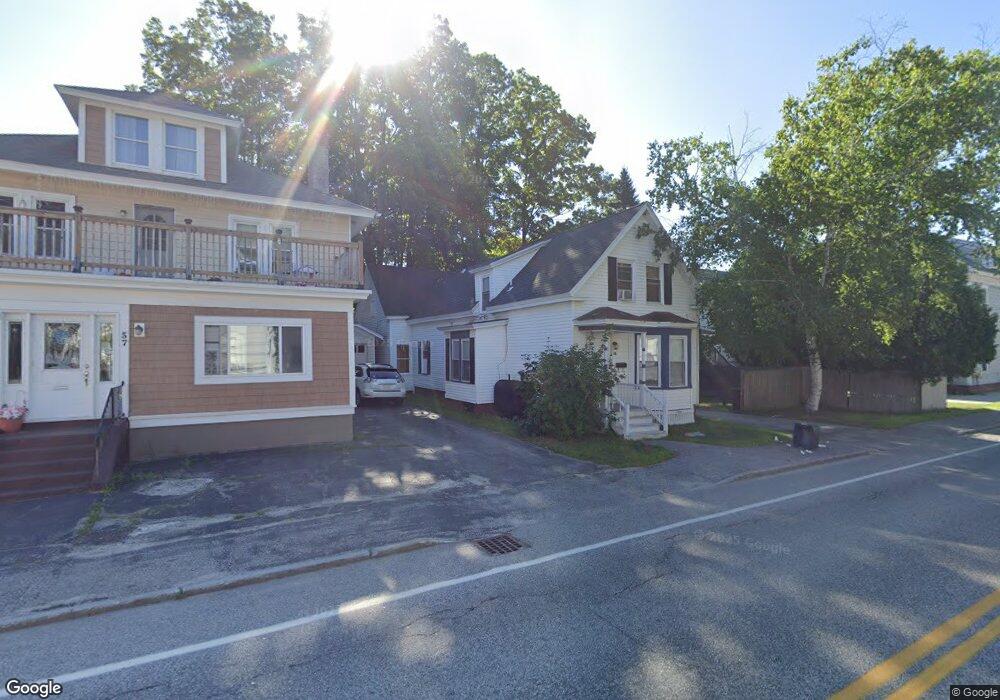
53 Goff St Auburn, ME 04210
Estimated Value: $258,000 - $295,000
4
Beds
2
Baths
1,900
Sq Ft
$147/Sq Ft
Est. Value
About This Home
This home is located at 53 Goff St, Auburn, ME 04210 and is currently estimated at $278,920, approximately $146 per square foot. 53 Goff St is a home located in Androscoggin County with nearby schools including Park Avenue Elementary School, Auburn Middle School, and Edward Little High School.
Ownership History
Date
Name
Owned For
Owner Type
Purchase Details
Closed on
Mar 10, 2011
Sold by
Millwood Lisa L and Usa Irs
Bought by
Soundview Home Loan T and Wells Fargo Bank Na
Current Estimated Value
Purchase Details
Closed on
Jan 4, 2007
Sold by
Bennett Lanette M
Bought by
Millwood Lisa L
Home Financials for this Owner
Home Financials are based on the most recent Mortgage that was taken out on this home.
Original Mortgage
$85,000
Interest Rate
9.25%
Mortgage Type
Unknown
Create a Home Valuation Report for This Property
The Home Valuation Report is an in-depth analysis detailing your home's value as well as a comparison with similar homes in the area
Home Values in the Area
Average Home Value in this Area
Purchase History
| Date | Buyer | Sale Price | Title Company |
|---|---|---|---|
| Soundview Home Loan T | -- | -- | |
| Millwood Lisa L | -- | -- |
Source: Public Records
Mortgage History
| Date | Status | Borrower | Loan Amount |
|---|---|---|---|
| Previous Owner | Millwood Lisa L | $110,400 | |
| Previous Owner | Millwood Lisa L | $85,000 |
Source: Public Records
Tax History
| Year | Tax Paid | Tax Assessment Tax Assessment Total Assessment is a certain percentage of the fair market value that is determined by local assessors to be the total taxable value of land and additions on the property. | Land | Improvement |
|---|---|---|---|---|
| 2024 | $3,687 | $165,700 | $21,900 | $143,800 |
| 2023 | $3,349 | $147,200 | $19,400 | $127,800 |
| 2022 | $3,349 | $147,200 | $19,400 | $127,800 |
| 2021 | $2,906 | $122,000 | $16,200 | $105,800 |
| 2020 | $2,898 | $122,000 | $16,200 | $105,800 |
| 2019 | $2,898 | $122,000 | $16,200 | $105,800 |
| 2018 | $2,872 | $121,300 | $16,200 | $105,100 |
| 2017 | $2,791 | $121,400 | $16,200 | $105,200 |
| 2016 | $2,713 | $121,400 | $16,200 | $105,200 |
| 2015 | $2,580 | $121,400 | $16,200 | $105,200 |
| 2013 | -- | $121,200 | $16,200 | $105,000 |
Source: Public Records
Map
Nearby Homes