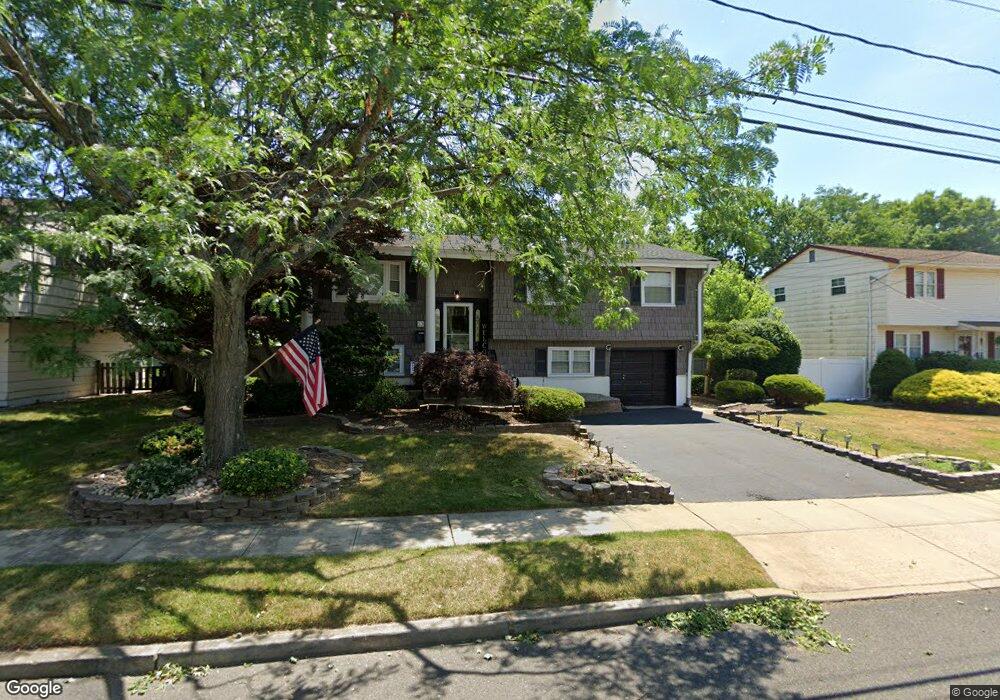
53 Gramercy Rd Old Bridge, NJ 08857
Estimated Value: $601,000 - $755,000
5
Beds
2
Baths
2,056
Sq Ft
$334/Sq Ft
Est. Value
About This Home
This home is located at 53 Gramercy Rd, Old Bridge, NJ 08857 and is currently estimated at $687,071, approximately $334 per square foot. 53 Gramercy Rd is a home located in Middlesex County with nearby schools including Old Bridge High School, St. Ambrose School, and Calvary Christian School.
Ownership History
Date
Name
Owned For
Owner Type
Purchase Details
Closed on
Feb 19, 2024
Sold by
Balzano Taylor
Bought by
Balzano Taylor and Balzano Louis
Current Estimated Value
Purchase Details
Closed on
Sep 21, 2020
Sold by
Corio Francis and Kelly Corio Tina
Bought by
Rodrin Taylor and Balzano Louis
Home Financials for this Owner
Home Financials are based on the most recent Mortgage that was taken out on this home.
Original Mortgage
$445,500
Interest Rate
3.05%
Mortgage Type
New Conventional
Purchase Details
Closed on
Aug 13, 2007
Sold by
Wendling Joseph and Wendling Anne
Bought by
Corio Francis and Kelly Tina
Home Financials for this Owner
Home Financials are based on the most recent Mortgage that was taken out on this home.
Original Mortgage
$255,000
Interest Rate
6.71%
Mortgage Type
New Conventional
Create a Home Valuation Report for This Property
The Home Valuation Report is an in-depth analysis detailing your home's value as well as a comparison with similar homes in the area
Home Values in the Area
Average Home Value in this Area
Purchase History
| Date | Buyer | Sale Price | Title Company |
|---|---|---|---|
| Balzano Taylor | -- | Wfg National Title | |
| Rodrin Taylor | $495,000 | Watson Abstract Setmnt Svcs | |
| Corio Francis | $430,000 | -- |
Source: Public Records
Mortgage History
| Date | Status | Borrower | Loan Amount |
|---|---|---|---|
| Previous Owner | Rodrin Taylor | $445,500 | |
| Previous Owner | Corio Francis | $255,000 |
Source: Public Records
Tax History
| Year | Tax Paid | Tax Assessment Tax Assessment Total Assessment is a certain percentage of the fair market value that is determined by local assessors to be the total taxable value of land and additions on the property. | Land | Improvement |
|---|---|---|---|---|
| 2025 | $9,351 | $165,600 | $72,200 | $93,400 |
| 2024 | $8,971 | $165,600 | $72,200 | $93,400 |
Source: Public Records
Map
Nearby Homes
- 22 Tuscarora Cir
- 21 Warren Dr
- 24 Owens Rd
- 26 Front Ct
- 50 Victory Ct
- 119 Nightingale Ct
- 52 Gaub Rd
- 107 Nightingale Ct
- 236 Community Cir
- 50 Creighton Cir
- 25 Morsell Place
- 132 Southwood Dr
- 27 Mabaline Rd
- 26 Exeter St
- 1122 Marlboro Rd
- 18 Andover Rd
- 109 Throckmorton Ln
- 16 Twain Ave
- 587 Marlboro Rd
- 11 Lincroft Ave
Your Personal Tour Guide
Ask me questions while you tour the home.