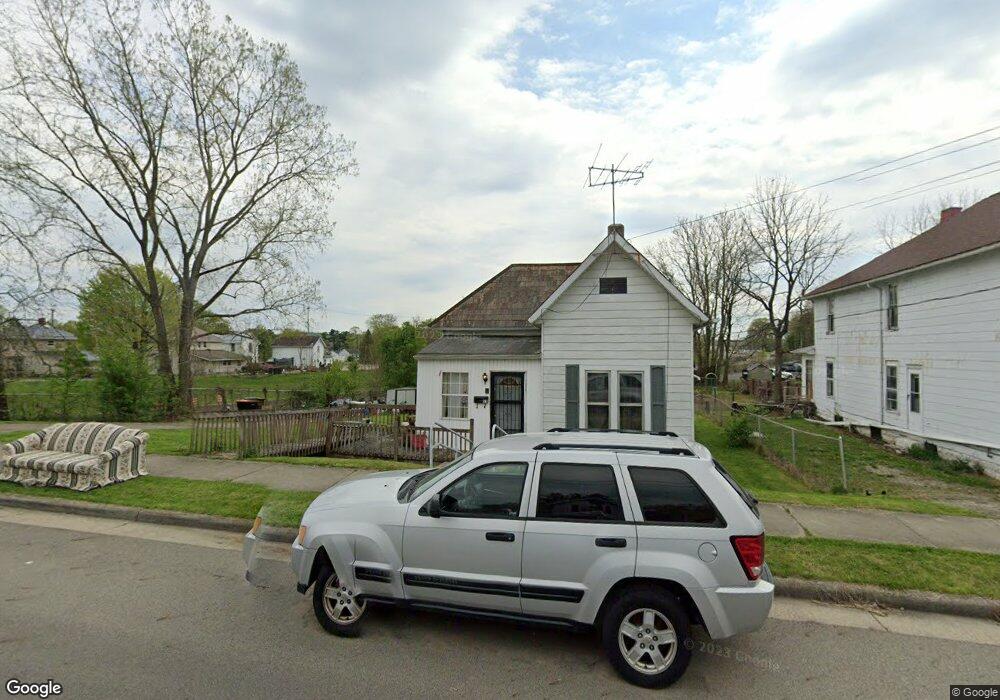
53 Hancock St Newark, OH 43055
Estimated Value: $100,000 - $154,000
2
Beds
1
Bath
744
Sq Ft
$179/Sq Ft
Est. Value
About This Home
This home is located at 53 Hancock St, Newark, OH 43055 and is currently estimated at $133,124, approximately $178 per square foot. 53 Hancock St is a home located in Licking County with nearby schools including Mcguffey Elementary School, Wilson Middle School, and Newark High School.
Ownership History
Date
Name
Owned For
Owner Type
Purchase Details
Closed on
May 7, 2010
Sold by
Ricciardo William R and Ricciardo Suzanne G
Bought by
Ricciardo Gloria Lyn and The Ricciardo Keystone Inheritance Trust
Current Estimated Value
Purchase Details
Closed on
Feb 15, 2007
Sold by
Ricciardo Steven R and Ricciardo Elizabeth
Bought by
Ricciardo William R and Ricciardo Suzanne G
Home Financials for this Owner
Home Financials are based on the most recent Mortgage that was taken out on this home.
Original Mortgage
$46,000
Outstanding Balance
$27,659
Interest Rate
6.23%
Mortgage Type
Unknown
Estimated Equity
$105,465
Purchase Details
Closed on
Dec 21, 1995
Sold by
Dove Doren C
Bought by
Ricciardo Et Al Steven R Ricciardo
Home Financials for this Owner
Home Financials are based on the most recent Mortgage that was taken out on this home.
Original Mortgage
$25,110
Interest Rate
7.43%
Mortgage Type
New Conventional
Create a Home Valuation Report for This Property
The Home Valuation Report is an in-depth analysis detailing your home's value as well as a comparison with similar homes in the area
Home Values in the Area
Average Home Value in this Area
Purchase History
| Date | Buyer | Sale Price | Title Company |
|---|---|---|---|
| Ricciardo Gloria Lyn | -- | None Available | |
| Ricciardo William R | $51,000 | Title Fi | |
| Ricciardo Et Al Steven R Ricciardo | $27,900 | -- |
Source: Public Records
Mortgage History
| Date | Status | Borrower | Loan Amount |
|---|---|---|---|
| Open | Ricciardo William R | $46,000 | |
| Closed | Ricciardo Et Al Steven R Ricciardo | $25,110 |
Source: Public Records
Tax History Compared to Growth
Tax History
| Year | Tax Paid | Tax Assessment Tax Assessment Total Assessment is a certain percentage of the fair market value that is determined by local assessors to be the total taxable value of land and additions on the property. | Land | Improvement |
|---|---|---|---|---|
| 2024 | $966 | $26,290 | $8,750 | $17,540 |
| 2023 | $1,401 | $26,290 | $8,750 | $17,540 |
| 2022 | $881 | $21,350 | $6,300 | $15,050 |
| 2021 | $924 | $21,350 | $6,300 | $15,050 |
| 2020 | $945 | $21,350 | $6,300 | $15,050 |
| 2019 | $776 | $16,840 | $5,250 | $11,590 |
| 2018 | $776 | $0 | $0 | $0 |
| 2017 | $807 | $0 | $0 | $0 |
| 2016 | $851 | $0 | $0 | $0 |
| 2015 | $870 | $0 | $0 | $0 |
| 2014 | $1,084 | $0 | $0 | $0 |
| 2013 | $853 | $0 | $0 | $0 |
Source: Public Records
Map
Nearby Homes