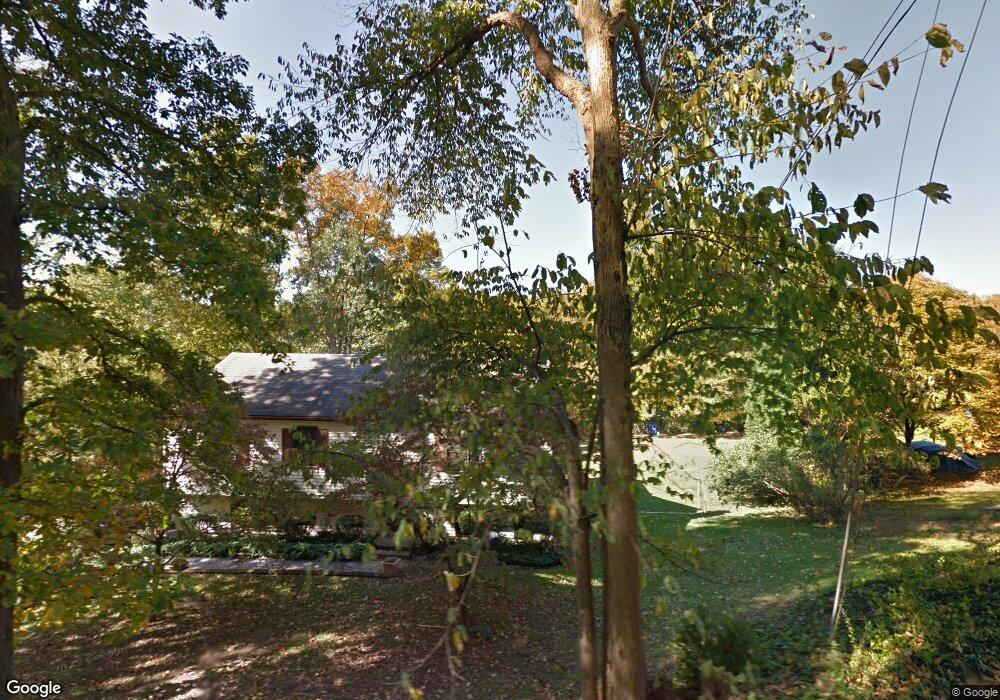
53 Heacock Crossbrook Rd New Milford, CT 06776
Estimated Value: $398,000 - $510,090
4
Beds
3
Baths
1,472
Sq Ft
$323/Sq Ft
Est. Value
About This Home
This home is located at 53 Heacock Crossbrook Rd, New Milford, CT 06776 and is currently estimated at $474,773, approximately $322 per square foot. 53 Heacock Crossbrook Rd is a home located in Litchfield County with nearby schools including Northville Elementary School, Sarah Noble Intermediate School, and Schaghticoke Middle School.
Ownership History
Date
Name
Owned For
Owner Type
Purchase Details
Closed on
Sep 17, 2021
Sold by
Vinhateiro Caludio J
Bought by
Vinhateiro Brenda A
Current Estimated Value
Home Financials for this Owner
Home Financials are based on the most recent Mortgage that was taken out on this home.
Original Mortgage
$156,700
Interest Rate
2.86%
Mortgage Type
Stand Alone Refi Refinance Of Original Loan
Purchase Details
Closed on
Jul 1, 1988
Sold by
Shutak Paul
Bought by
Vinhateiro Claudio
Home Financials for this Owner
Home Financials are based on the most recent Mortgage that was taken out on this home.
Original Mortgage
$124,900
Interest Rate
10.47%
Mortgage Type
Purchase Money Mortgage
Create a Home Valuation Report for This Property
The Home Valuation Report is an in-depth analysis detailing your home's value as well as a comparison with similar homes in the area
Home Values in the Area
Average Home Value in this Area
Purchase History
| Date | Buyer | Sale Price | Title Company |
|---|---|---|---|
| Vinhateiro Brenda A | -- | None Available | |
| Vinhateiro Brenda A | -- | None Available | |
| Vinhateiro Claudio | $184,900 | -- |
Source: Public Records
Mortgage History
| Date | Status | Borrower | Loan Amount |
|---|---|---|---|
| Previous Owner | Vinhateiro Brenda A | $156,700 | |
| Previous Owner | Vinhateiro Claudio | $186,000 | |
| Previous Owner | Vinhateiro Claudio | $121,000 | |
| Previous Owner | Vinhateiro Claudio | $124,900 |
Source: Public Records
Tax History Compared to Growth
Tax History
| Year | Tax Paid | Tax Assessment Tax Assessment Total Assessment is a certain percentage of the fair market value that is determined by local assessors to be the total taxable value of land and additions on the property. | Land | Improvement |
|---|---|---|---|---|
| 2025 | $9,599 | $203,060 | $58,090 | $144,970 |
| 2024 | $6,045 | $203,060 | $58,090 | $144,970 |
| 2023 | $5,885 | $203,060 | $58,090 | $144,970 |
| 2022 | $5,757 | $203,060 | $58,090 | $144,970 |
| 2021 | $6,204 | $203,060 | $58,090 | $144,970 |
| 2020 | $5,567 | $194,110 | $64,400 | $129,710 |
| 2019 | $5,571 | $194,110 | $64,400 | $129,710 |
| 2018 | $5,468 | $194,110 | $64,400 | $129,710 |
| 2017 | $5,289 | $194,110 | $64,400 | $129,710 |
| 2016 | $5,196 | $194,110 | $64,400 | $129,710 |
| 2015 | $5,119 | $191,380 | $64,400 | $126,980 |
| 2014 | $5,033 | $191,380 | $64,400 | $126,980 |
Source: Public Records
Map
Nearby Homes
- 57 Second Hill Rd
- 5 N Brook Hollow Dr S
- 18 Outlook Rd
- 61 Park Lane Rd
- 74 Park Lane Rd
- 24 Whittlesey Ave
- 77 Carlson Ridge Rd
- 57 Carlson Ridge Rd Unit 57
- 59 Carlson Ridge Rd
- 1 Canterbury Arms
- 0 Chestnut Land Rd Unit 24024843
- 0 Chestnut Land Rd Unit 24024823
- 173 Wellsville Ave
- 183 Second Hill Rd
- 87 Aspetuck Village
- 71 Upper Reservoir Rd
- 2 Chatfield Rd
- 18 Green Pond Rd
- 15 Legion Rd
- 12 Wells Rd
- 55 Heacock Crossbrook Rd
- 57 Heacock Crossbrook Rd
- 59 Heacock Crossbrook Rd
- 15 Brushy Hill Rd
- 11 Brushy Hill Rd
- 7 Brushy Hill Rd
- 61 Heacock Crossbrook Rd
- 24 Heacock Crossbrook Rd
- 5 Brushy Hill Rd
- 5 Weantinock Dr
- 7 Weantinock Dr
- 3 Weantinock Dr
- 20 Heacock Crossbrook Rd
- 1 Brushy Hill Rd
- 1 Weantinock Dr
- 8 Weantinock Dr
- 11 Weantinock Dr
- 53 Second Hill Rd
- 6 Weantinock Dr
- 1 Farmers Ln