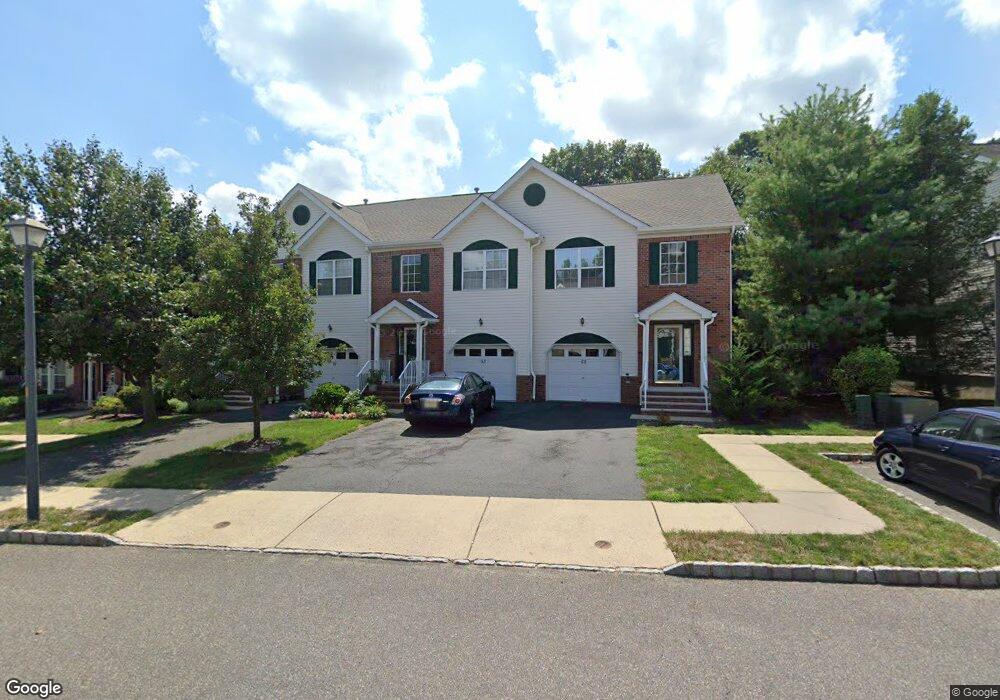
53 Heron Ct Manalapan, NJ 07726
Estimated Value: $467,442 - $527,000
2
Beds
3
Baths
1,444
Sq Ft
$340/Sq Ft
Est. Value
About This Home
This home is located at 53 Heron Ct, Manalapan, NJ 07726 and is currently estimated at $491,361, approximately $340 per square foot. 53 Heron Ct is a home located in Monmouth County with nearby schools including Manalapan-Englishtown Middle School, Pine Brook Elementary School, and Manalapan High School.
Ownership History
Date
Name
Owned For
Owner Type
Purchase Details
Closed on
Oct 6, 2000
Sold by
Tracy Village Associates
Bought by
Madison Yi Huan and Madison Joo
Current Estimated Value
Home Financials for this Owner
Home Financials are based on the most recent Mortgage that was taken out on this home.
Original Mortgage
$137,900
Outstanding Balance
$50,183
Interest Rate
7.89%
Estimated Equity
$441,178
Create a Home Valuation Report for This Property
The Home Valuation Report is an in-depth analysis detailing your home's value as well as a comparison with similar homes in the area
Home Values in the Area
Average Home Value in this Area
Purchase History
| Date | Buyer | Sale Price | Title Company |
|---|---|---|---|
| Madison Yi Huan | $172,400 | -- |
Source: Public Records
Mortgage History
| Date | Status | Borrower | Loan Amount |
|---|---|---|---|
| Open | Madison Yi Huan | $137,900 |
Source: Public Records
Tax History Compared to Growth
Tax History
| Year | Tax Paid | Tax Assessment Tax Assessment Total Assessment is a certain percentage of the fair market value that is determined by local assessors to be the total taxable value of land and additions on the property. | Land | Improvement |
|---|---|---|---|---|
| 2025 | $6,421 | $444,200 | $132,200 | $312,000 |
| 2024 | $6,211 | $380,400 | $84,000 | $296,400 |
| 2023 | $6,211 | $373,500 | $84,000 | $289,500 |
| 2022 | $6,146 | $334,700 | $59,000 | $275,700 |
| 2021 | $6,146 | $295,200 | $50,000 | $245,200 |
| 2020 | $5,910 | $286,900 | $40,000 | $246,900 |
| 2019 | $6,453 | $312,800 | $68,500 | $244,300 |
| 2018 | $5,915 | $284,900 | $48,500 | $236,400 |
| 2017 | $5,791 | $279,100 | $45,000 | $234,100 |
| 2016 | $5,466 | $266,100 | $32,300 | $233,800 |
| 2015 | $5,456 | $262,800 | $32,300 | $230,500 |
| 2014 | $5,540 | $260,100 | $50,000 | $210,100 |
Source: Public Records
Map
Nearby Homes
- 0 Tracy Station Rd
- 12 Emily Rd
- 13 Lasatta Ave
- 2605 Charleston Dr
- 0 Private St Unit 22508862
- 3504 Charleston Dr
- 29 Wilson Ave
- 68 Main St
- 2 Dey St
- Yorktown Plan at Manalapan Grove
- 21 Lone Star Ln
- 52 Crimson Dr
- 19 Weamaconk Dr
- 39 Crimson Dr
- 33 Tennent Ave
- 28 Whittier Dr
- 32 Primrose Ct
- 24 Primrose Ct
- 63 Atrium Way Unit 6-3
- 30 Primrose Ct