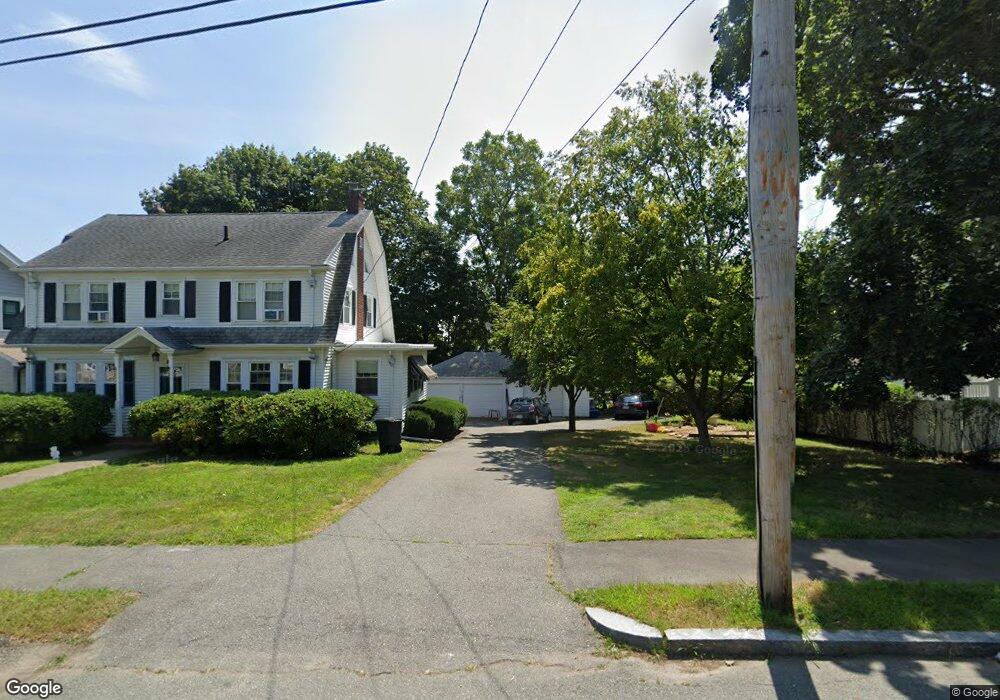
53 Highfield Rd Quincy, MA 02169
Merrymount NeighborhoodEstimated Value: $817,000 - $926,000
4
Beds
2
Baths
1,939
Sq Ft
$454/Sq Ft
Est. Value
About This Home
This home is located at 53 Highfield Rd, Quincy, MA 02169 and is currently estimated at $880,170, approximately $453 per square foot. 53 Highfield Rd is a home located in Norfolk County with nearby schools including Merrymount Elementary School, Broad Meadows Middle School, and Quincy High School.
Ownership History
Date
Name
Owned For
Owner Type
Purchase Details
Closed on
Sep 11, 2023
Sold by
Hanlon Richard J
Bought by
Hanlon Ft and Hanlon
Current Estimated Value
Purchase Details
Closed on
Jan 30, 2009
Sold by
Hanlon Wendy H and Mckenna Wendy H
Bought by
Hanlon Richard J and Hanlon Wendy H
Create a Home Valuation Report for This Property
The Home Valuation Report is an in-depth analysis detailing your home's value as well as a comparison with similar homes in the area
Home Values in the Area
Average Home Value in this Area
Purchase History
| Date | Buyer | Sale Price | Title Company |
|---|---|---|---|
| Hanlon Ft | -- | None Available | |
| Hanlon Richard J | -- | -- |
Source: Public Records
Tax History
| Year | Tax Paid | Tax Assessment Tax Assessment Total Assessment is a certain percentage of the fair market value that is determined by local assessors to be the total taxable value of land and additions on the property. | Land | Improvement |
|---|---|---|---|---|
| 2025 | $9,844 | $853,800 | $399,700 | $454,100 |
| 2024 | $9,394 | $833,500 | $388,300 | $445,200 |
| 2023 | $8,384 | $753,300 | $338,300 | $415,000 |
| 2022 | $8,126 | $678,300 | $282,500 | $395,800 |
| 2021 | $8,065 | $664,300 | $282,500 | $381,800 |
| 2020 | $7,564 | $608,500 | $271,800 | $336,700 |
| 2019 | $7,229 | $576,000 | $254,400 | $321,600 |
| 2018 | $6,801 | $509,800 | $211,800 | $298,000 |
| 2017 | $6,987 | $493,100 | $221,900 | $271,200 |
| 2016 | $6,761 | $470,800 | $217,800 | $253,000 |
| 2015 | $6,406 | $438,800 | $205,800 | $233,000 |
| 2014 | $6,096 | $410,200 | $199,800 | $210,400 |
Source: Public Records
Map
Nearby Homes
- 105 Sea St Unit 105
- 105 Sea St Unit 102
- 25 Moffat Rd
- 28 Edgewood Cir
- 11 Plover Rd
- 20 Whitney Rd Unit 1
- 20 Whitney Rd Unit 6
- 20 Whitney Rd Unit 2
- 96 Utica St
- 66 Mcgrath Hwy Unit 302
- 66 Mcgrath Hwy Unit 402
- 66 Mcgrath Hwy Unit 309
- 66 Mcgrath Hwy Unit 201
- 1025 Hancock St Unit 6J
- 1025 Hancock St Unit 2K
- 59 Spear St Unit 201
- 59 Spear St Unit 302
- 59 Spear St Unit 402
- 59 Spear St Unit 202
- 59 Spear St Unit 301
- 61 Highfield Rd
- 49 Highfield Rd
- 65 Highfield Rd
- 18 Pontiac Rd
- 14 Pontiac Rd
- 56 Highfield Rd
- 24 Pontiac Rd
- 64 Highfield Rd
- 52 Highfield Rd
- 10 Pontiac Rd
- 69 Highfield Rd
- 43 Highfield Rd
- 1418 Quincy Shore Dr
- 30 Pontiac Rd
- 44 Highfield Rd
- 4 Pontiac Rd
- 185 Samoset Ave
- 165 Samoset Ave
- 1428 Quincy Shore Dr
- 161 Samoset Ave
Your Personal Tour Guide
Ask me questions while you tour the home.