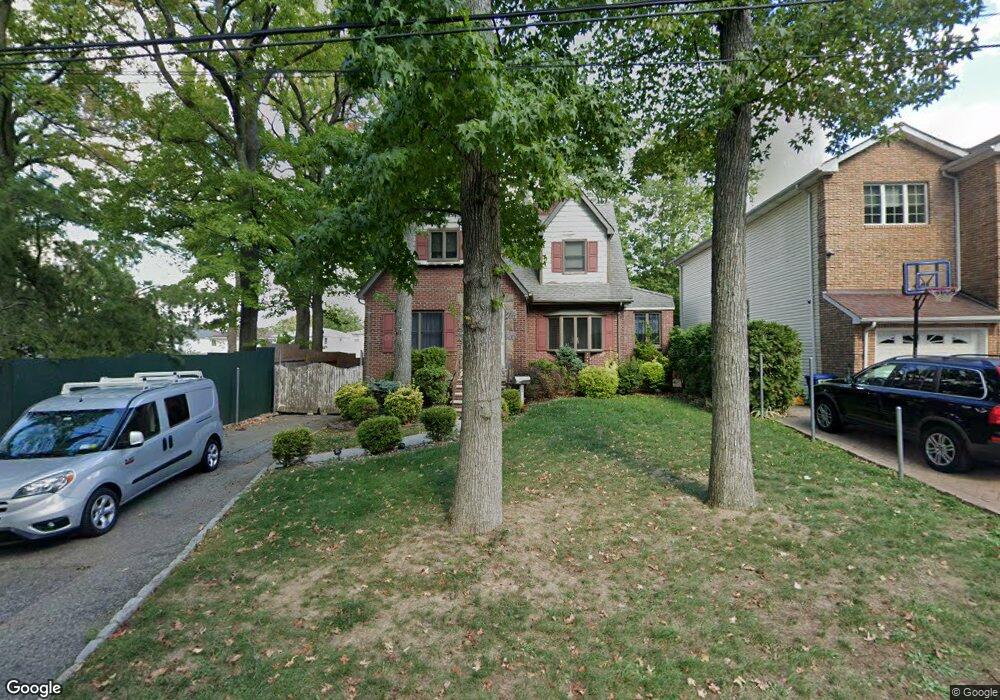
53 Highland Rd Staten Island, NY 10308
Great Kills NeighborhoodEstimated Value: $772,000 - $884,000
--
Bed
4
Baths
1,850
Sq Ft
$453/Sq Ft
Est. Value
About This Home
This home is located at 53 Highland Rd, Staten Island, NY 10308 and is currently estimated at $837,137, approximately $452 per square foot. 53 Highland Rd is a home located in Richmond County with nearby schools including P.S. 53 The Barbara Esselborn School, Myra S. Barnes Intermediate School 24, and New Dorp High School.
Ownership History
Date
Name
Owned For
Owner Type
Purchase Details
Closed on
Mar 16, 2022
Sold by
Borg Joseph A and Borg Ellen Mary
Bought by
Borg Joseph
Current Estimated Value
Purchase Details
Closed on
Jan 29, 2002
Sold by
Parker Kenneth and Costa Maria
Bought by
Borg Joseph A and Borg Mary Ellen
Home Financials for this Owner
Home Financials are based on the most recent Mortgage that was taken out on this home.
Original Mortgage
$89,931
Interest Rate
7%
Mortgage Type
Purchase Money Mortgage
Purchase Details
Closed on
Oct 29, 1998
Sold by
Mcmanus Lydia and Tuzza Lydia Lucy
Bought by
Parker Kenneth
Home Financials for this Owner
Home Financials are based on the most recent Mortgage that was taken out on this home.
Original Mortgage
$140,000
Interest Rate
6.8%
Mortgage Type
Stand Alone First
Purchase Details
Closed on
Dec 8, 1996
Sold by
Kirkwood Doris
Bought by
Parker Kenneth and Costa Maria
Purchase Details
Closed on
Dec 5, 1996
Sold by
Kirkwood Doris
Bought by
Morri Construction Inc
Create a Home Valuation Report for This Property
The Home Valuation Report is an in-depth analysis detailing your home's value as well as a comparison with similar homes in the area
Home Values in the Area
Average Home Value in this Area
Purchase History
| Date | Buyer | Sale Price | Title Company |
|---|---|---|---|
| Borg Joseph | -- | Thompson Lloyd D | |
| Borg Joseph A | $314,500 | -- | |
| Parker Kenneth | $140,000 | Chicago Title Insurance Co | |
| Parker Kenneth | $185,000 | Transamerica Title Ins Compa | |
| Morri Construction Inc | $130,000 | Transamerica Title Ins Compa |
Source: Public Records
Mortgage History
| Date | Status | Borrower | Loan Amount |
|---|---|---|---|
| Previous Owner | Borg Joseph A | $89,931 | |
| Previous Owner | Parker Kenneth | $140,000 |
Source: Public Records
Tax History Compared to Growth
Tax History
| Year | Tax Paid | Tax Assessment Tax Assessment Total Assessment is a certain percentage of the fair market value that is determined by local assessors to be the total taxable value of land and additions on the property. | Land | Improvement |
|---|---|---|---|---|
| 2025 | $5,986 | $56,400 | $8,536 | $47,864 |
| 2024 | $5,986 | $47,520 | $9,558 | $37,962 |
| 2023 | $5,647 | $28,117 | $7,944 | $20,173 |
| 2022 | $5,295 | $45,960 | $15,240 | $30,720 |
| 2021 | $5,582 | $40,620 | $15,240 | $25,380 |
| 2020 | $5,572 | $36,360 | $15,240 | $21,120 |
| 2019 | $5,195 | $39,480 | $15,240 | $24,240 |
| 2018 | $4,776 | $23,431 | $8,243 | $15,188 |
| 2017 | $4,506 | $22,105 | $7,998 | $14,107 |
| 2016 | $4,419 | $22,105 | $8,856 | $13,249 |
| 2015 | $3,667 | $21,937 | $7,453 | $14,484 |
| 2014 | $3,667 | $20,696 | $7,449 | $13,247 |
Source: Public Records
Map
Nearby Homes
- 3723 Amboy Rd
- 3721 Amboy Rd
- 3745 Amboy Rd Unit 10B
- 3747 Amboy Rd Unit 6b
- 142 Great Kills Rd Unit A
- 0 Dent Rd
- 3865 Amboy Rd Unit 2g
- 3865 Amboy Rd Unit 4a
- 3865 Amboy Rd Unit 4d
- 3865 Amboy Rd Unit 3d
- 3865 Amboy Rd Unit 3f
- 3865 Amboy Rd Unit 4g
- 3865 Amboy Rd Unit 4b
- 42 Greaves Ave
- 289 Maybury Ave
- 252 Timber Ridge Dr Unit 9252
- 272 Timber Ridge Dr Unit 5272
- 264 Timber Ridge Dr Unit 5264
- 46 Meadow Ln Unit B13
- 163 Keegans Ln
- 59 Highland Rd
- 41 Highland Rd
- 515 O'Gorman Ave
- 515 Ogorman Ave
- 509 Ogorman Ave
- 509 O'Gorman Ave
- 514 Ogorman Ave Unit 517
- 514-517 Ogorman Ave
- 514 O'Gorman Ave
- 69 Highland Rd
- 37 Highland Rd
- 48 Fieldway Ave
- 60 Fieldway Ave
- 39 Highland Rd
- 56 Highland Rd
- 40 Highland Rd
- 46 Highland Rd
- 73 Highland Rd
- 44 Fieldway Ave
- 74 Fieldway Ave