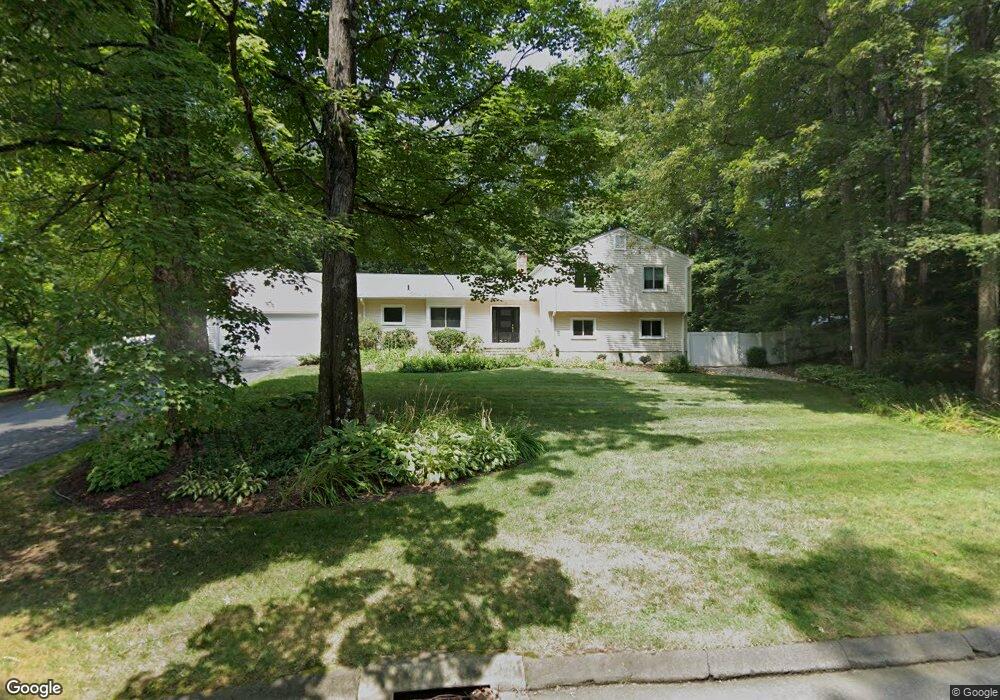
53 Highwood Rd Farmington, CT 06032
Estimated Value: $600,000 - $705,375
4
Beds
3
Baths
1,888
Sq Ft
$357/Sq Ft
Est. Value
About This Home
This home is located at 53 Highwood Rd, Farmington, CT 06032 and is currently estimated at $673,594, approximately $356 per square foot. 53 Highwood Rd is a home located in Hartford County with nearby schools including Union School, West Woods Upper Elementary School, and Irving A. Robbins Middle School.
Ownership History
Date
Name
Owned For
Owner Type
Purchase Details
Closed on
Nov 26, 2018
Sold by
Machlarz Katarzyna J
Bought by
Earle Jonathan S
Current Estimated Value
Purchase Details
Closed on
Sep 24, 2009
Sold by
Zalevsky Olga
Bought by
Earle Jonathan S L and Machlarz Katarzyna J
Home Financials for this Owner
Home Financials are based on the most recent Mortgage that was taken out on this home.
Original Mortgage
$447,700
Interest Rate
5.31%
Purchase Details
Closed on
Aug 1, 2006
Sold by
Shea John J and Doskow-Shea Susan L
Bought by
Zalevsky Olga
Home Financials for this Owner
Home Financials are based on the most recent Mortgage that was taken out on this home.
Original Mortgage
$370,000
Interest Rate
6.67%
Purchase Details
Closed on
Aug 26, 1997
Sold by
Sibarium Alan
Bought by
Shea John J and Doscow Susan L
Purchase Details
Closed on
Aug 15, 1995
Sold by
Mag Patricia P
Bought by
Sibarium Alan and Sibarium Dora
Create a Home Valuation Report for This Property
The Home Valuation Report is an in-depth analysis detailing your home's value as well as a comparison with similar homes in the area
Home Values in the Area
Average Home Value in this Area
Purchase History
| Date | Buyer | Sale Price | Title Company |
|---|---|---|---|
| Earle Jonathan S | -- | -- | |
| Earle Jonathan S L | $460,000 | -- | |
| Zalevsky Olga | $470,000 | -- | |
| Shea John J | $240,000 | -- | |
| Sibarium Alan | $232,000 | -- |
Source: Public Records
Mortgage History
| Date | Status | Borrower | Loan Amount |
|---|---|---|---|
| Previous Owner | Sibarium Alan | $304,800 | |
| Previous Owner | Sibarium Alan | $447,700 | |
| Previous Owner | Sibarium Alan | $370,000 |
Source: Public Records
Tax History Compared to Growth
Tax History
| Year | Tax Paid | Tax Assessment Tax Assessment Total Assessment is a certain percentage of the fair market value that is determined by local assessors to be the total taxable value of land and additions on the property. | Land | Improvement |
|---|---|---|---|---|
| 2025 | $9,207 | $345,870 | $100,380 | $245,490 |
| 2024 | $8,097 | $318,150 | $100,380 | $217,770 |
| 2023 | $7,702 | $318,150 | $100,380 | $217,770 |
| 2022 | $7,131 | $243,200 | $80,330 | $162,870 |
| 2021 | $7,007 | $243,200 | $80,330 | $162,870 |
| 2020 | $6,802 | $243,200 | $80,330 | $162,870 |
| 2019 | $6,802 | $243,200 | $80,330 | $162,870 |
| 2018 | $6,610 | $243,200 | $80,330 | $162,870 |
| 2017 | $6,919 | $259,350 | $100,550 | $158,800 |
| 2016 | $6,686 | $259,350 | $100,550 | $158,800 |
| 2015 | $6,486 | $259,350 | $100,550 | $158,800 |
| 2014 | $6,338 | $259,330 | $100,520 | $158,810 |
Source: Public Records
Map
Nearby Homes
- 49 Northwoods Rd
- 52 Knollwood Rd
- 1622 Farmington Ave Unit 4
- 14 Springwood Rd
- 115 W Avon Rd
- 267 New Britain Ave
- 224 New Britain Ave Unit 14
- 2 Muirfield Ln
- 22 Heritage Dr Unit 22
- 1782 Farmington Ave
- 15 Aspenwood
- 57 New Britain Ave Unit 59
- 26 Sunrise Dr
- 159 Haynes Rd
- 55 Depot Place
- 94 Sanford Ave
- 19 Chestnut Dr
- 3 Putnam Ln Unit 3
- 6 Redwood Ln Unit 6
- 638 W Avon Rd