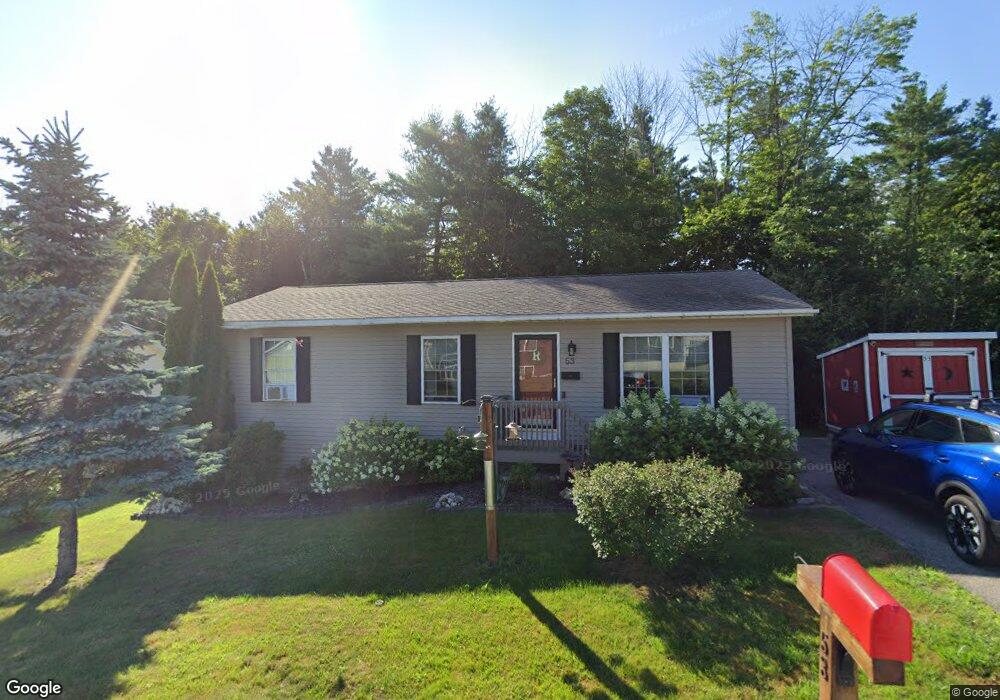
53 Hillcrest Ave Lewiston, ME 04240
Estimated Value: $275,000 - $333,000
3
Beds
1
Bath
1,150
Sq Ft
$272/Sq Ft
Est. Value
About This Home
This home is located at 53 Hillcrest Ave, Lewiston, ME 04240 and is currently estimated at $312,341, approximately $271 per square foot. 53 Hillcrest Ave is a home located in Androscoggin County with nearby schools including Farwell Elementary School, Lewiston High School, and Acadia Academy School.
Ownership History
Date
Name
Owned For
Owner Type
Purchase Details
Closed on
Mar 31, 2008
Sold by
Coastal Enterprise Inc
Bought by
Ross Christopher A and Ross Jennifer L
Current Estimated Value
Home Financials for this Owner
Home Financials are based on the most recent Mortgage that was taken out on this home.
Original Mortgage
$143,010
Outstanding Balance
$88,781
Interest Rate
5.76%
Mortgage Type
FHA
Estimated Equity
$223,560
Create a Home Valuation Report for This Property
The Home Valuation Report is an in-depth analysis detailing your home's value as well as a comparison with similar homes in the area
Home Values in the Area
Average Home Value in this Area
Purchase History
| Date | Buyer | Sale Price | Title Company |
|---|---|---|---|
| Ross Christopher A | -- | -- |
Source: Public Records
Mortgage History
| Date | Status | Borrower | Loan Amount |
|---|---|---|---|
| Open | Ross Christopher A | $143,010 |
Source: Public Records
Tax History Compared to Growth
Tax History
| Year | Tax Paid | Tax Assessment Tax Assessment Total Assessment is a certain percentage of the fair market value that is determined by local assessors to be the total taxable value of land and additions on the property. | Land | Improvement |
|---|---|---|---|---|
| 2025 | $3,662 | $111,700 | $24,850 | $86,850 |
| 2024 | $3,549 | $111,700 | $24,850 | $86,850 |
| 2023 | $3,351 | $111,700 | $24,850 | $86,850 |
| 2022 | $3,183 | $111,700 | $24,850 | $86,850 |
| 2021 | $3,157 | $111,700 | $24,850 | $86,850 |
| 2020 | $3,178 | $110,850 | $24,850 | $86,000 |
| 2019 | $3,205 | $110,850 | $24,850 | $86,000 |
| 2018 | $3,178 | $110,850 | $24,850 | $86,000 |
| 2017 | $3,106 | $110,850 | $24,850 | $86,000 |
| 2016 | $3,053 | $110,850 | $24,850 | $86,000 |
| 2015 | $3,034 | $110,850 | $24,850 | $86,000 |
| 2014 | $2,948 | $110,850 | $24,850 | $86,000 |
| 2013 | $2,931 | $110,850 | $24,850 | $86,000 |
Source: Public Records
Map
Nearby Homes