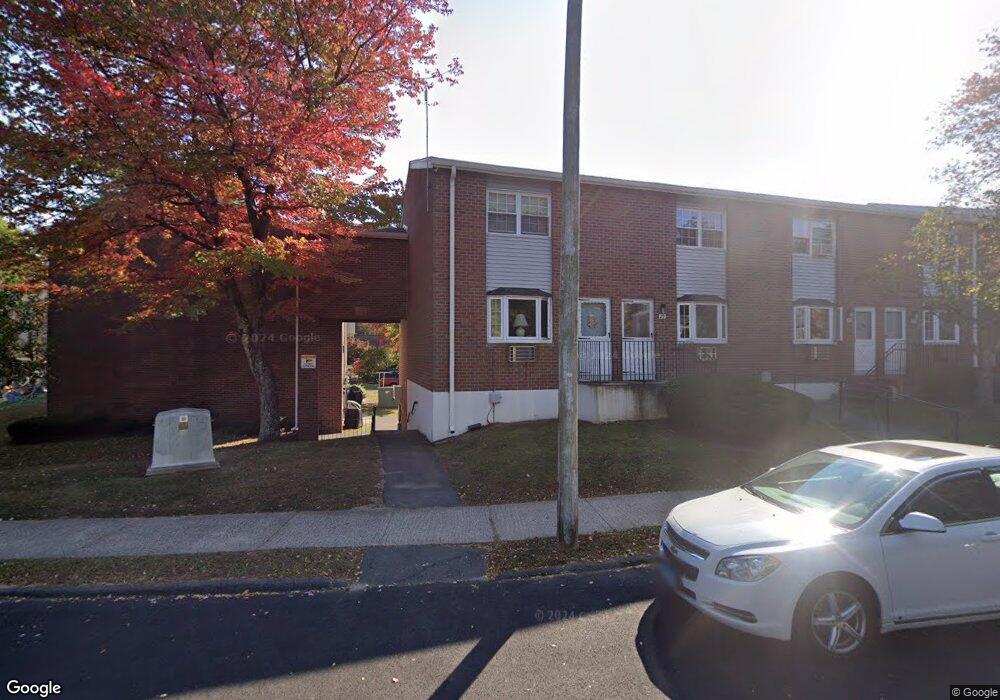
53 Hiltbrand Rd Unit 3-4 Bristol, CT 06010
Forestville NeighborhoodEstimated Value: $128,000 - $137,000
2
Beds
2
Baths
990
Sq Ft
$135/Sq Ft
Est. Value
About This Home
This home is located at 53 Hiltbrand Rd Unit 3-4, Bristol, CT 06010 and is currently estimated at $133,581, approximately $134 per square foot. 53 Hiltbrand Rd Unit 3-4 is a home located in Hartford County with nearby schools including Northeast Middle School, Bristol Eastern High School, and St Matthew School.
Ownership History
Date
Name
Owned For
Owner Type
Purchase Details
Closed on
Aug 14, 2024
Sold by
Raptis George
Bought by
Raptis Stella and Raptis Ermioni
Current Estimated Value
Purchase Details
Closed on
Jan 5, 2022
Sold by
Hanelt Stanley R and Hanelt Sarah C
Bought by
Raptis George and Raptis Ermioni
Purchase Details
Closed on
Apr 21, 1997
Sold by
Morris Dean R and Morris Michele S
Bought by
Hanelt Stanley R and Hanelt Sarah C
Purchase Details
Closed on
Dec 31, 1987
Sold by
Diamond Norman L
Bought by
White Michele S
Home Financials for this Owner
Home Financials are based on the most recent Mortgage that was taken out on this home.
Original Mortgage
$90,000
Interest Rate
10.59%
Mortgage Type
Purchase Money Mortgage
Create a Home Valuation Report for This Property
The Home Valuation Report is an in-depth analysis detailing your home's value as well as a comparison with similar homes in the area
Home Values in the Area
Average Home Value in this Area
Purchase History
| Date | Buyer | Sale Price | Title Company |
|---|---|---|---|
| Raptis Stella | -- | None Available | |
| Raptis Stella | -- | None Available | |
| Raptis George | $89,000 | None Available | |
| Raptis George | $89,000 | None Available | |
| Hanelt Stanley R | $27,000 | -- | |
| Hanelt Stanley R | $27,000 | -- | |
| White Michele S | $98,000 | -- |
Source: Public Records
Mortgage History
| Date | Status | Borrower | Loan Amount |
|---|---|---|---|
| Previous Owner | White Michele S | $90,000 |
Source: Public Records
Tax History Compared to Growth
Tax History
| Year | Tax Paid | Tax Assessment Tax Assessment Total Assessment is a certain percentage of the fair market value that is determined by local assessors to be the total taxable value of land and additions on the property. | Land | Improvement |
|---|---|---|---|---|
| 2025 | $2,254 | $66,780 | $0 | $66,780 |
| 2024 | $2,127 | $66,780 | $0 | $66,780 |
| 2023 | $2,027 | $66,780 | $0 | $66,780 |
| 2022 | $1,737 | $45,290 | $0 | $45,290 |
| 2021 | $1,737 | $45,290 | $0 | $45,290 |
| 2020 | $1,737 | $45,290 | $0 | $45,290 |
| 2019 | $1,723 | $45,290 | $0 | $45,290 |
| 2018 | $1,670 | $45,290 | $0 | $45,290 |
| 2017 | $2,020 | $56,070 | $0 | $56,070 |
| 2016 | $2,020 | $56,070 | $0 | $56,070 |
| 2015 | $1,941 | $56,070 | $0 | $56,070 |
| 2014 | $1,941 | $56,070 | $0 | $56,070 |
Source: Public Records
Map
Nearby Homes
- 43 Hiltbrand Rd Unit 2-11
- 90 Boardman St Unit A2
- 44 Cabot St
- 1325 Farmington Ave Unit 2
- 42 Sandy Dr
- 58 Matilda Dr
- 437 Stafford Ave
- 12 Currey Ct
- 1469 Farmington Ave Unit 17
- 245 Mark St
- 52 Barbara Rd
- 302 Brook St
- 56 Collier Ave
- 50 Vantana Dr
- 81 Vincent Rd
- 51 Songbird Ln
- 16 Cardinal Dr
- 27 Adeline Ave
- 73 Grove Ave
- 0 Overlook Dr Unit Lot 4 24092448
- 53 Hiltbrand Rd Unit 3-7
- 53 Hiltbrand Rd Unit 3-6
- 53 Hiltbrand Rd Unit 3-12
- 53 Hiltbrand Rd Unit 3-11
- 53 Hiltbrand Rd Unit 3-10
- 53 Hiltbrand Rd Unit 3-9
- 53 Hiltbrand Rd Unit 3-8
- 53 Hiltbrand Rd Unit 3-5
- 53 Hiltbrand Rd Unit 3-3
- 53 Hiltbrand Rd Unit 3-2
- 53 Hiltbrand Rd Unit 3-1
- 63 Hiltbrand Rd Unit 4-2
- 63 Hiltbrand Rd Unit 4-12
- 63 Hiltbrand Rd Unit 4-11
- 63 Hiltbrand Rd Unit 4-10
- 63 Hiltbrand Rd Unit 4-9
- 63 Hiltbrand Rd Unit 4-8
- 63 Hiltbrand Rd Unit 4-7
- 63 Hiltbrand Rd Unit 4-6