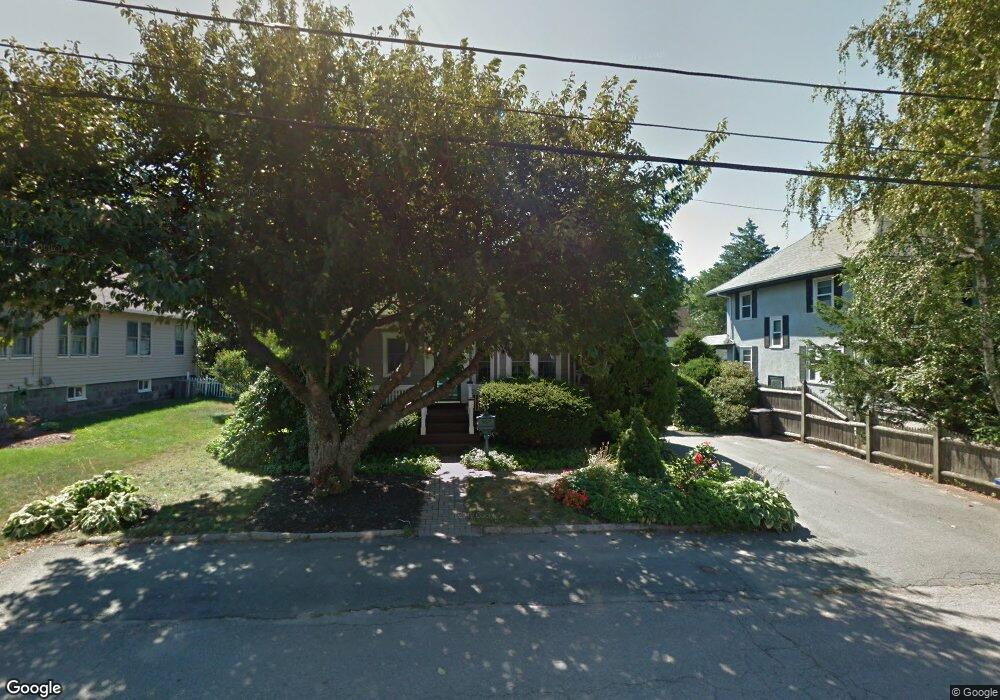
53 Holmes St Braintree, MA 02184
East Braintree NeighborhoodEstimated Value: $812,544 - $919,000
3
Beds
2
Baths
2,009
Sq Ft
$427/Sq Ft
Est. Value
About This Home
This home is located at 53 Holmes St, Braintree, MA 02184 and is currently estimated at $856,886, approximately $426 per square foot. 53 Holmes St is a home located in Norfolk County with nearby schools including Braintree High School, Meeting House Montessori School, and Step Ahead Kindergarten.
Ownership History
Date
Name
Owned For
Owner Type
Purchase Details
Closed on
Sep 28, 2022
Sold by
Assmus Carolyn L
Bought by
Carolyn L Assmus 2022 Ret
Current Estimated Value
Purchase Details
Closed on
Mar 24, 1995
Sold by
Mcadams George F
Bought by
Logan Peter J
Home Financials for this Owner
Home Financials are based on the most recent Mortgage that was taken out on this home.
Original Mortgage
$43,000
Interest Rate
8.78%
Mortgage Type
Purchase Money Mortgage
Purchase Details
Closed on
Nov 20, 1978
Bought by
Assmus Richard C and Assmus Carol
Create a Home Valuation Report for This Property
The Home Valuation Report is an in-depth analysis detailing your home's value as well as a comparison with similar homes in the area
Home Values in the Area
Average Home Value in this Area
Purchase History
| Date | Buyer | Sale Price | Title Company |
|---|---|---|---|
| Carolyn L Assmus 2022 Ret | -- | None Available | |
| Logan Peter J | $32,900 | -- | |
| Logan Peter J | $32,900 | -- | |
| Assmus Richard C | -- | -- |
Source: Public Records
Mortgage History
| Date | Status | Borrower | Loan Amount |
|---|---|---|---|
| Previous Owner | Assmus Richard C | $38,200 | |
| Previous Owner | Assmus Richard C | $43,000 | |
| Previous Owner | Assmus Richard C | $43,000 |
Source: Public Records
Tax History
| Year | Tax Paid | Tax Assessment Tax Assessment Total Assessment is a certain percentage of the fair market value that is determined by local assessors to be the total taxable value of land and additions on the property. | Land | Improvement |
|---|---|---|---|---|
| 2025 | $7,003 | $701,700 | $352,800 | $348,900 |
| 2024 | $6,104 | $643,900 | $330,800 | $313,100 |
| 2023 | $5,885 | $603,000 | $299,900 | $303,100 |
| 2022 | $5,649 | $567,700 | $264,600 | $303,100 |
| 2021 | $5,251 | $527,700 | $264,600 | $263,100 |
| 2020 | $4,790 | $485,800 | $232,800 | $253,000 |
| 2019 | $4,581 | $454,000 | $232,800 | $221,200 |
| 2018 | $4,292 | $407,200 | $194,000 | $213,200 |
| 2017 | $4,373 | $407,200 | $194,000 | $213,200 |
| 2016 | $4,135 | $376,600 | $176,400 | $200,200 |
| 2015 | $4,062 | $366,900 | $173,800 | $193,100 |
| 2014 | $4,023 | $352,300 | $157,900 | $194,400 |
Source: Public Records
Map
Nearby Homes
- 9 Independence Ave Unit 307
- 192 Federal Ave Unit B
- 17 White Rd
- 177 Franklin St
- 347 Centre St
- 155 Kendrick Ave Unit 502
- 21 Totman St Unit 308
- 21 Totman St Unit 404
- 21 Totman St Unit 309
- 21 Totman St Unit 307
- 21 Totman St Unit 203
- 21 Totman St Unit PH-406
- 21 Totman St Unit 408
- 21 Totman St Unit PH-401
- 21 Totman St Unit 2
- 21 Totman St Unit 207
- 166 Phipps St
- 50 N Payne St Unit 1
- 50 N Payne St Unit 4
- 29 Joseph Rd