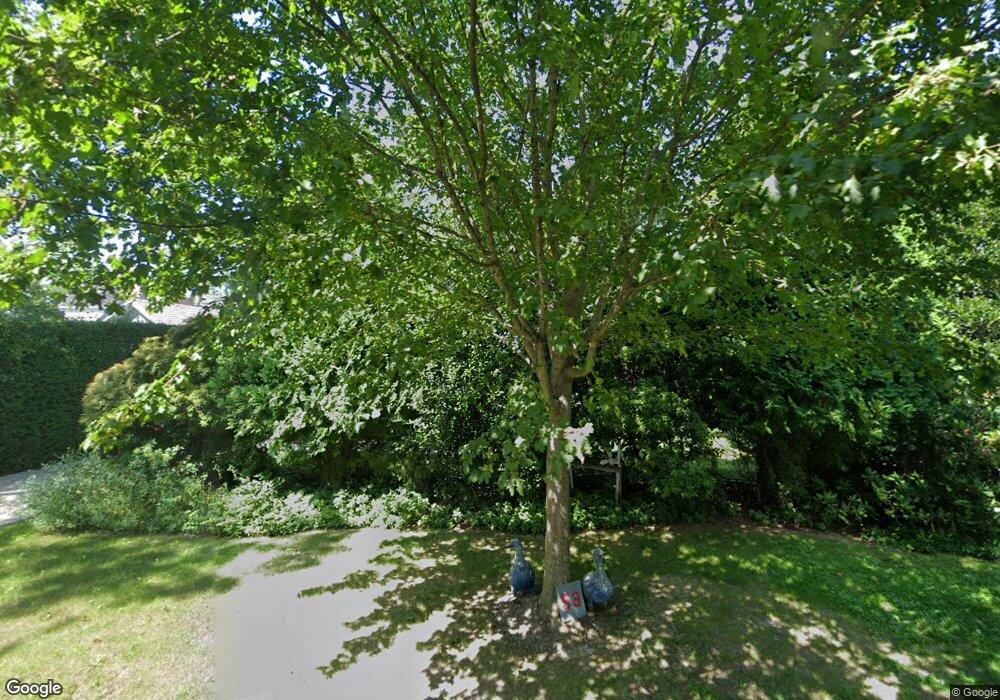
53 Howell St Southampton, NY 11968
Estimated Value: $1,274,000 - $2,595,000
2
Beds
1
Bath
584
Sq Ft
$2,945/Sq Ft
Est. Value
About This Home
This home is located at 53 Howell St, Southampton, NY 11968 and is currently estimated at $1,719,790, approximately $2,944 per square foot. 53 Howell St is a home located in Suffolk County with nearby schools including Southampton Elementary School, Southampton Intermediate School, and Southampton High School.
Ownership History
Date
Name
Owned For
Owner Type
Purchase Details
Closed on
Jun 15, 2012
Sold by
Debrigard Anne
Bought by
Moss Jane
Current Estimated Value
Purchase Details
Closed on
Mar 21, 2012
Sold by
Ciampaglia Nancy
Bought by
Debrigard Anne
Purchase Details
Closed on
Jan 17, 2006
Sold by
Debrigard Anne
Bought by
Ciampaglia Nancy
Purchase Details
Closed on
Sep 13, 1993
Sold by
Baker James N
Bought by
Baker James
Create a Home Valuation Report for This Property
The Home Valuation Report is an in-depth analysis detailing your home's value as well as a comparison with similar homes in the area
Home Values in the Area
Average Home Value in this Area
Purchase History
| Date | Buyer | Sale Price | Title Company |
|---|---|---|---|
| Moss Jane | $575,000 | Fidelity National Title Insu | |
| Debrigard Anne | -- | Fidelity National Title | |
| Ciampaglia Nancy | $625,000 | Deirdre S Venables | |
| Ciampaglia Nancy | $625,000 | Deirdre S Venables | |
| Baker James | -- | Chicago Title Insurance Comp |
Source: Public Records
Tax History Compared to Growth
Tax History
| Year | Tax Paid | Tax Assessment Tax Assessment Total Assessment is a certain percentage of the fair market value that is determined by local assessors to be the total taxable value of land and additions on the property. | Land | Improvement |
|---|---|---|---|---|
| 2024 | $1,509 | $890,600 | $821,400 | $69,200 |
| 2023 | $1,509 | $890,600 | $821,400 | $69,200 |
| 2022 | $3,762 | $890,600 | $821,400 | $69,200 |
| 2021 | $3,762 | $905,400 | $821,400 | $84,000 |
| 2020 | $1,522 | $905,400 | $821,400 | $84,000 |
| 2019 | $1,470 | $0 | $0 | $0 |
| 2018 | -- | $932,200 | $857,200 | $75,000 |
| 2017 | $2,816 | $932,200 | $857,200 | $75,000 |
| 2016 | $2,489 | $789,300 | $714,300 | $75,000 |
| 2015 | -- | $610,700 | $535,700 | $75,000 |
| 2014 | -- | $610,700 | $535,700 | $75,000 |
Source: Public Records
Map
Nearby Homes