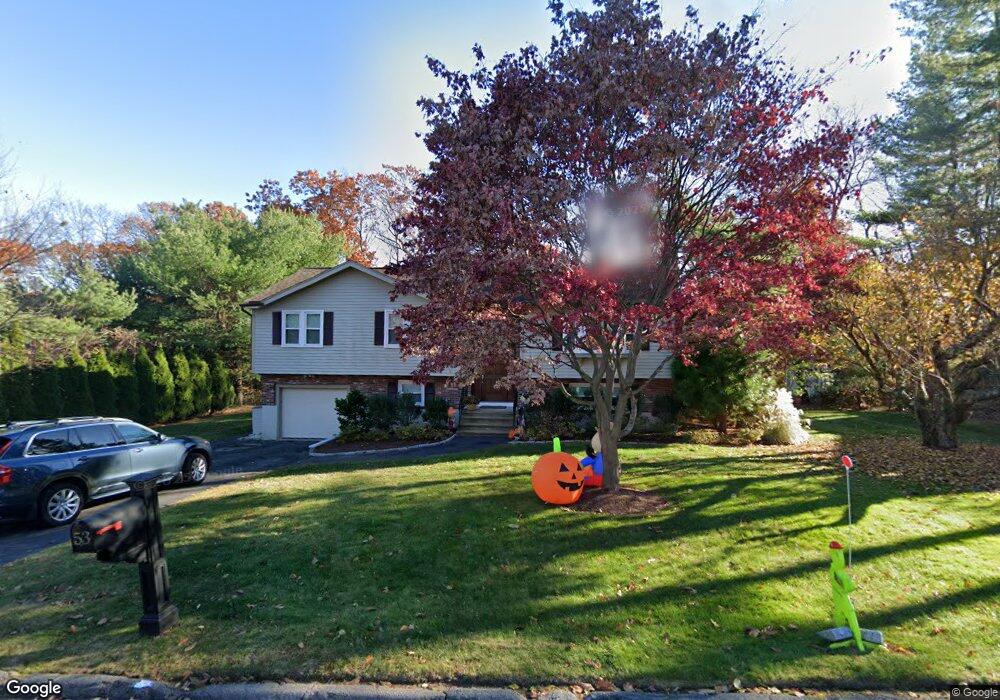
53 Independence Dr Unit 53 Woburn, MA 01801
Cummingsville NeighborhoodEstimated Value: $954,463 - $1,098,000
3
Beds
3
Baths
2,300
Sq Ft
$446/Sq Ft
Est. Value
About This Home
This home is located at 53 Independence Dr Unit 53, Woburn, MA 01801 and is currently estimated at $1,026,616, approximately $446 per square foot. 53 Independence Dr Unit 53 is a home located in Middlesex County with nearby schools including Reeves Elementary School, Daniel L. Joyce Middle School, and Woburn High School.
Ownership History
Date
Name
Owned For
Owner Type
Purchase Details
Closed on
Jan 21, 2022
Sold by
Daniele Francesco F and Daniele Suzanne F
Bought by
Perry Samuel and Lisle Jessica
Current Estimated Value
Home Financials for this Owner
Home Financials are based on the most recent Mortgage that was taken out on this home.
Original Mortgage
$720,000
Outstanding Balance
$660,849
Interest Rate
3.11%
Mortgage Type
Purchase Money Mortgage
Estimated Equity
$365,767
Purchase Details
Closed on
Mar 8, 2016
Sold by
Oneill Kevin P and Oneill Chorlette P
Bought by
Daniele Francesco F and Daniele Suzanne F
Home Financials for this Owner
Home Financials are based on the most recent Mortgage that was taken out on this home.
Original Mortgage
$434,000
Interest Rate
3.81%
Mortgage Type
New Conventional
Purchase Details
Closed on
May 5, 1995
Sold by
Miller Ft and Miller
Bought by
Oneil Kevin P and Penlington Chorlette
Create a Home Valuation Report for This Property
The Home Valuation Report is an in-depth analysis detailing your home's value as well as a comparison with similar homes in the area
Home Values in the Area
Average Home Value in this Area
Purchase History
| Date | Buyer | Sale Price | Title Company |
|---|---|---|---|
| Perry Samuel | $849,500 | None Available | |
| Daniele Francesco F | $542,500 | -- | |
| Oneil Kevin P | $190,000 | -- | |
| Oneil Kevin P | $190,000 | -- |
Source: Public Records
Mortgage History
| Date | Status | Borrower | Loan Amount |
|---|---|---|---|
| Open | Perry Samuel | $720,000 | |
| Previous Owner | Daniele Francesco F | $434,000 | |
| Previous Owner | Oneil Kevin P | $307,500 |
Source: Public Records
Tax History Compared to Growth
Tax History
| Year | Tax Paid | Tax Assessment Tax Assessment Total Assessment is a certain percentage of the fair market value that is determined by local assessors to be the total taxable value of land and additions on the property. | Land | Improvement |
|---|---|---|---|---|
| 2025 | $6,847 | $801,700 | $390,800 | $410,900 |
| 2024 | $6,440 | $799,000 | $372,500 | $426,500 |
| 2023 | $6,228 | $715,900 | $338,600 | $377,300 |
| 2022 | $5,999 | $642,300 | $294,500 | $347,800 |
| 2021 | $5,735 | $614,700 | $280,700 | $334,000 |
| 2020 | $5,526 | $592,900 | $280,700 | $312,200 |
| 2019 | $5,299 | $557,800 | $267,600 | $290,200 |
| 2018 | $5,079 | $513,500 | $245,900 | $267,600 |
| 2017 | $4,650 | $467,800 | $234,400 | $233,400 |
| 2016 | $4,442 | $442,000 | $219,400 | $222,600 |
| 2015 | $4,279 | $420,700 | $205,300 | $215,400 |
| 2014 | $4,181 | $400,500 | $205,300 | $195,200 |
Source: Public Records
Map
Nearby Homes
- 15 Crescent Rd
- 123 Cambridge Rd Unit 4
- 14 Saw Mill Brook Way
- 185 Lexington St
- 192 Lexington St
- 2 Howard Ct
- 36 Cambridge Rd Unit 40
- 212 Cambridge Rd
- 14 Liana St
- 68 Hammond Place Unit 68
- 19 Hammond Place Unit 19
- 49 Duren Ave
- 9 Pond Terrace
- 7 Grace Rd
- 92 Muller Rd
- 7 Locust St
- 162 North St
- 273 Cambridge Rd Unit 202
- 18 Winn Valley Dr
- 21 Derby Dr Unit 21
- 53 Independence Dr
- 51 Independence Dr
- 57 Independence Dr
- 11 Crescent Rd
- 38 Independence Dr
- 36 Independence Dr
- 9 Crescent Rd
- 40 Independence Dr
- 49 Independence Dr
- 59 Independence Dr
- 34 Independence Dr
- 28 Independence Dr
- 42 Independence Dr
- 7 Crescent Rd
- 30 Independence Dr
- 26 Independence Dr
- 17 Crescent Rd
- 18 Independence Dr
- 47 Independence Dr
- 16 Independence Dr