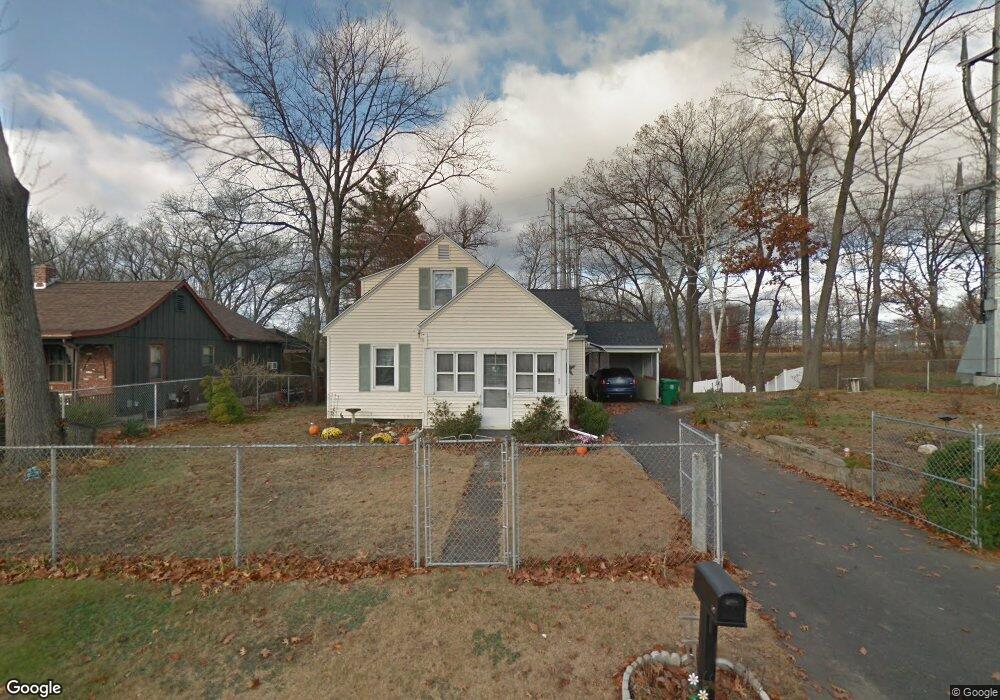
53 Ingham St Chicopee, MA 01013
Fairview NeighborhoodEstimated Value: $269,000 - $313,000
2
Beds
1
Bath
1,193
Sq Ft
$246/Sq Ft
Est. Value
About This Home
This home is located at 53 Ingham St, Chicopee, MA 01013 and is currently estimated at $293,407, approximately $245 per square foot. 53 Ingham St is a home located in Hampden County with nearby schools including Streiber Elementary School, Fairview Middle School, and Chicopee Comprehensive High School.
Ownership History
Date
Name
Owned For
Owner Type
Purchase Details
Closed on
Sep 23, 2002
Sold by
Obuchowski Stella M
Bought by
Pilachowski Sharon
Current Estimated Value
Home Financials for this Owner
Home Financials are based on the most recent Mortgage that was taken out on this home.
Original Mortgage
$15,000
Outstanding Balance
$6,321
Interest Rate
6.36%
Mortgage Type
Purchase Money Mortgage
Estimated Equity
$287,086
Create a Home Valuation Report for This Property
The Home Valuation Report is an in-depth analysis detailing your home's value as well as a comparison with similar homes in the area
Home Values in the Area
Average Home Value in this Area
Purchase History
| Date | Buyer | Sale Price | Title Company |
|---|---|---|---|
| Pilachowski Sharon | $113,000 | -- |
Source: Public Records
Mortgage History
| Date | Status | Borrower | Loan Amount |
|---|---|---|---|
| Open | Pilachowski Sharon | $15,000 |
Source: Public Records
Tax History
| Year | Tax Paid | Tax Assessment Tax Assessment Total Assessment is a certain percentage of the fair market value that is determined by local assessors to be the total taxable value of land and additions on the property. | Land | Improvement |
|---|---|---|---|---|
| 2025 | $3,826 | $252,400 | $114,600 | $137,800 |
| 2024 | $3,631 | $246,000 | $112,400 | $133,600 |
| 2023 | $3,398 | $224,300 | $102,200 | $122,100 |
| 2022 | $3,245 | $191,000 | $88,800 | $102,200 |
| 2021 | $3,055 | $173,500 | $80,700 | $92,800 |
| 2020 | $2,958 | $169,400 | $82,900 | $86,500 |
| 2019 | $2,931 | $163,200 | $82,900 | $80,300 |
| 2018 | $2,838 | $155,000 | $79,000 | $76,000 |
| 2017 | $2,846 | $164,400 | $72,400 | $92,000 |
| 2016 | $2,704 | $159,900 | $72,400 | $87,500 |
| 2015 | $2,905 | $165,600 | $72,400 | $93,200 |
| 2014 | $1,452 | $165,600 | $72,400 | $93,200 |
Source: Public Records
Map
Nearby Homes
- 442 Prospect St
- 83 Old Farm Rd
- 460 Irene St
- 88 Prospect St
- 340 Pendleton Ave
- 119 Oakridge St
- 15 Cross St
- 52 Falmouth Rd
- 47 N Canal St
- 88 Newell St
- 199 Clemente St
- 207 Clemente St
- 20 Mount Carmel Ave
- 81 Mccarthy Ave
- 35 Mount Vernon Rd
- 341 Montcalm St
- 15 Hudson Ave
- 61 Saint Jacques Ave
- 35 Silvin Rd
- 58 Robinridge Rd
Your Personal Tour Guide
Ask me questions while you tour the home.