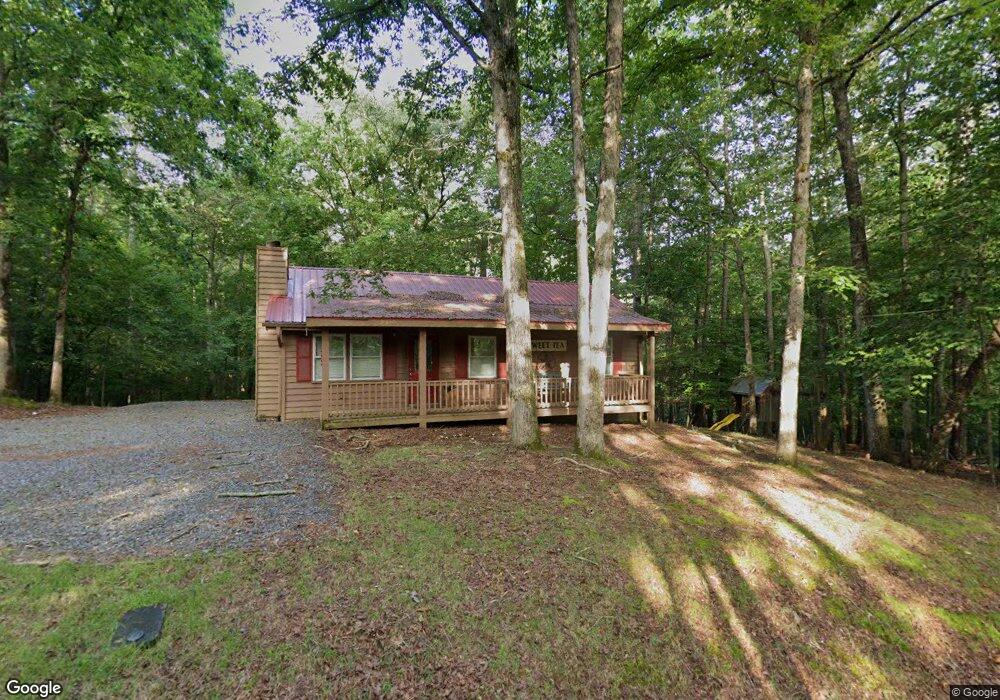
53 Ivy St Unit 1112 Ellijay, GA 30540
Estimated Value: $195,000 - $307,000
3
Beds
1
Bath
912
Sq Ft
$292/Sq Ft
Est. Value
About This Home
This home is located at 53 Ivy St Unit 1112, Ellijay, GA 30540 and is currently estimated at $266,206, approximately $291 per square foot. 53 Ivy St Unit 1112 is a home located in Gilmer County with nearby schools including Ellijay Elementary School, Gilmer Middle School, and Clear Creek Elementary School.
Ownership History
Date
Name
Owned For
Owner Type
Purchase Details
Closed on
Apr 19, 2013
Sold by
Ridgeline Capital Llc
Bought by
Jones Leslie M
Current Estimated Value
Home Financials for this Owner
Home Financials are based on the most recent Mortgage that was taken out on this home.
Original Mortgage
$59,250
Outstanding Balance
$42,049
Interest Rate
3.59%
Mortgage Type
New Conventional
Estimated Equity
$224,157
Purchase Details
Closed on
Jan 30, 2013
Sold by
Sec Of Housing & U
Bought by
Ridgeline Capital Llc
Purchase Details
Closed on
Jun 5, 2012
Sold by
Starkey Andrew M
Bought by
Wells Fargo Bank
Purchase Details
Closed on
May 1, 2012
Sold by
Wells Fargo Bank
Bought by
Sec Of Housing & Urban
Purchase Details
Closed on
Mar 10, 2005
Sold by
Hutchinson Karen
Bought by
Starkey Andrew M
Home Financials for this Owner
Home Financials are based on the most recent Mortgage that was taken out on this home.
Original Mortgage
$97,440
Interest Rate
5.54%
Mortgage Type
FHA
Purchase Details
Closed on
May 1, 1996
Bought by
Huthinson Karen
Purchase Details
Closed on
Mar 1, 1996
Bought by
Huthinson Karen
Purchase Details
Closed on
Oct 1, 1987
Bought by
Huthinson Karen
Purchase Details
Closed on
Sep 1, 1986
Bought by
Huthinson Karen
Create a Home Valuation Report for This Property
The Home Valuation Report is an in-depth analysis detailing your home's value as well as a comparison with similar homes in the area
Home Values in the Area
Average Home Value in this Area
Purchase History
| Date | Buyer | Sale Price | Title Company |
|---|---|---|---|
| Jones Leslie M | $79,000 | -- | |
| Ridgeline Capital Llc | $41,280 | -- | |
| Wells Fargo Bank | $87,200 | -- | |
| Sec Of Housing & Urban | -- | -- | |
| Starkey Andrew M | $99,000 | -- | |
| Huthinson Karen | $52,000 | -- | |
| Hutchinson Karen | -- | -- | |
| Huthinson Karen | -- | -- | |
| Huthinson Karen | -- | -- | |
| Huthinson Karen | -- | -- |
Source: Public Records
Mortgage History
| Date | Status | Borrower | Loan Amount |
|---|---|---|---|
| Open | Jones Leslie M | $59,250 | |
| Previous Owner | Starkey Andrew M | $97,440 |
Source: Public Records
Tax History Compared to Growth
Tax History
| Year | Tax Paid | Tax Assessment Tax Assessment Total Assessment is a certain percentage of the fair market value that is determined by local assessors to be the total taxable value of land and additions on the property. | Land | Improvement |
|---|---|---|---|---|
| 2024 | $1,105 | $85,212 | $3,400 | $81,812 |
| 2023 | $1,073 | $78,212 | $2,920 | $75,292 |
| 2022 | $1,057 | $66,252 | $2,000 | $64,252 |
| 2021 | $1,084 | $54,612 | $2,000 | $52,612 |
| 2020 | $937 | $42,580 | $1,920 | $40,660 |
| 2019 | $957 | $42,240 | $1,680 | $40,560 |
| 2018 | $932 | $40,640 | $1,680 | $38,960 |
| 2017 | $794 | $32,280 | $2,000 | $30,280 |
| 2016 | $818 | $32,600 | $2,000 | $30,600 |
| 2015 | $799 | $32,400 | $1,800 | $30,600 |
| 2014 | $740 | $28,880 | $1,800 | $27,080 |
| 2013 | -- | $23,580 | $1,800 | $21,780 |
Source: Public Records
Map
Nearby Homes
- 241 Lemmon Ln
- 241 Lemmon Ln Unit 1133
- 6 Spalding Cir
- 93 Amy Ln
- 400 Matrix Cir
- 360 Indigo Dr
- 105 River Knoll Trail
- 193 Alm Ln
- 193 Alm Ln Unit 1203 1204
- LT2159 Pacer Ct
- 0 Pacer Ct Unit 7551289
- 0 Pacer Ct Unit 10490543
- LT2159R Pacer Ct
- 23 Pacer Ct
- 1162 Spalding Cir
- 480 Palmetto Dr
- 419 Echo Ln
- 166 Riparian Way
- LT1944 Palmetto Dr