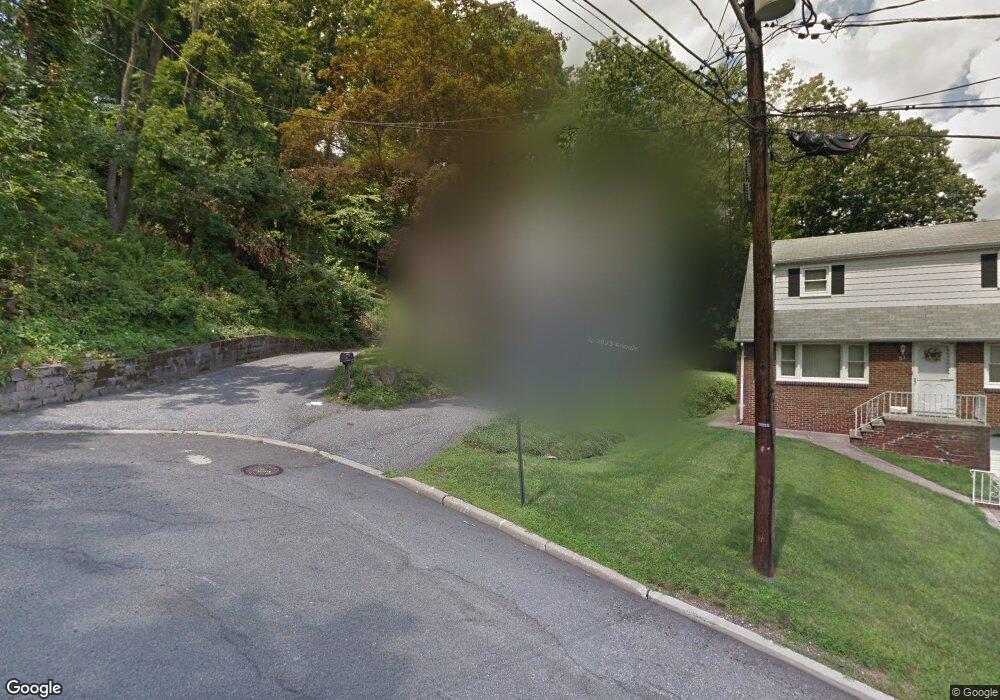
53 Jay St Clifton, NJ 07013
Maple Valley NeighborhoodEstimated Value: $542,557 - $651,000
Studio
--
Bath
1,480
Sq Ft
$416/Sq Ft
Est. Value
About This Home
This home is located at 53 Jay St, Clifton, NJ 07013 and is currently estimated at $615,139, approximately $415 per square foot. 53 Jay St is a home located in Passaic County with nearby schools including Clifton High School, The Magical Palace of Knowledge, and Saint Philip the Apostle Preparatory School.
Ownership History
Date
Name
Owned For
Owner Type
Purchase Details
Closed on
Sep 25, 2007
Sold by
Larowe Elizabeth
Bought by
Escobar Paola
Current Estimated Value
Home Financials for this Owner
Home Financials are based on the most recent Mortgage that was taken out on this home.
Original Mortgage
$309,600
Outstanding Balance
$196,106
Interest Rate
6.49%
Mortgage Type
New Conventional
Estimated Equity
$419,033
Purchase Details
Closed on
Jan 11, 2001
Sold by
Wesner Barbara
Bought by
Ford Bonny
Home Financials for this Owner
Home Financials are based on the most recent Mortgage that was taken out on this home.
Original Mortgage
$150,000
Interest Rate
7.13%
Create a Home Valuation Report for This Property
The Home Valuation Report is an in-depth analysis detailing your home's value as well as a comparison with similar homes in the area
Home Values in the Area
Average Home Value in this Area
Purchase History
| Date | Buyer | Sale Price | Title Company |
|---|---|---|---|
| Escobar Paola | $387,000 | -- | |
| Ford Bonny | $235,000 | -- |
Source: Public Records
Mortgage History
| Date | Status | Borrower | Loan Amount |
|---|---|---|---|
| Open | Escobar Paola | $309,600 | |
| Previous Owner | Ford Bonny | $150,000 |
Source: Public Records
Tax History
| Year | Tax Paid | Tax Assessment Tax Assessment Total Assessment is a certain percentage of the fair market value that is determined by local assessors to be the total taxable value of land and additions on the property. | Land | Improvement |
|---|---|---|---|---|
| 2025 | $10,394 | $175,100 | $84,200 | $90,900 |
| 2024 | $10,145 | $175,100 | $84,200 | $90,900 |
Source: Public Records
Map
Nearby Homes
- 27 Garrabrant Rd
- 83 Brownstone Rd
- 184 Abbe Ln
- 97 Long Hill Dr
- 225 Edison St
- 344 Maplewood Ave
- 22 Cliff Hill Rd
- 18 Mountainview Dr
- 38 Sherwood St
- 614 Rifle Camp Rd
- 3 Slate Ct Unit C3
- 3 Slate Ct Unit 707
- 73 AKA 77 Grove St
- 77 AKA 73 Grove St
- 61 Homestead St
- 375 Rifle Camp Rd Unit 307
- 12 Quartz Way
- 144 Silleck St
- 249 Silleck St
- 7 Cliff Rd Unit D3
Your Personal Tour Guide
Ask me questions while you tour the home.