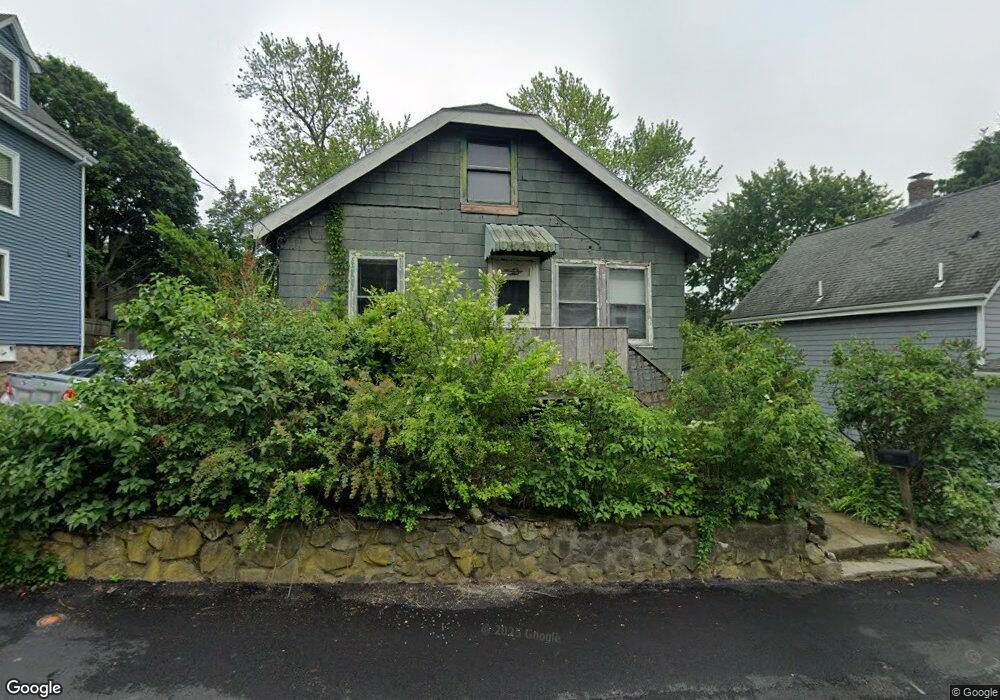
53 Jessie St Swampscott, MA 01907
Estimated Value: $334,000 - $481,115
2
Beds
1
Bath
894
Sq Ft
$425/Sq Ft
Est. Value
About This Home
This home is located at 53 Jessie St, Swampscott, MA 01907 and is currently estimated at $379,779, approximately $424 per square foot. 53 Jessie St is a home located in Essex County with nearby schools including Swampscott Middle School and Swampscott High School.
Ownership History
Date
Name
Owned For
Owner Type
Purchase Details
Closed on
Jan 10, 2025
Sold by
1953 Rt and Parrella
Bought by
53 Jessie Rt and Becker
Current Estimated Value
Home Financials for this Owner
Home Financials are based on the most recent Mortgage that was taken out on this home.
Original Mortgage
$248,500
Outstanding Balance
$246,331
Interest Rate
6.81%
Mortgage Type
Commercial
Estimated Equity
$133,448
Purchase Details
Closed on
May 24, 2013
Sold by
Parrella Donald C
Bought by
1953 Rt
Purchase Details
Closed on
Nov 21, 1978
Bought by
1953 Rt
Create a Home Valuation Report for This Property
The Home Valuation Report is an in-depth analysis detailing your home's value as well as a comparison with similar homes in the area
Home Values in the Area
Average Home Value in this Area
Purchase History
| Date | Buyer | Sale Price | Title Company |
|---|---|---|---|
| 53 Jessie Rt | $320,000 | None Available | |
| 53 Jessie Rt | $320,000 | None Available | |
| 53 Jessie Rt | $320,000 | None Available | |
| 53 Jessie Rt | $320,000 | None Available | |
| 1953 Rt | -- | -- | |
| 1953 Rt | -- | -- | |
| 1953 Rt | -- | -- |
Source: Public Records
Mortgage History
| Date | Status | Borrower | Loan Amount |
|---|---|---|---|
| Open | 53 Jessie Rt | $248,500 | |
| Closed | 53 Jessie Rt | $248,500 |
Source: Public Records
Tax History Compared to Growth
Tax History
| Year | Tax Paid | Tax Assessment Tax Assessment Total Assessment is a certain percentage of the fair market value that is determined by local assessors to be the total taxable value of land and additions on the property. | Land | Improvement |
|---|---|---|---|---|
| 2025 | $4,530 | $394,900 | $233,900 | $161,000 |
| 2024 | $4,429 | $385,500 | $222,800 | $162,700 |
| 2023 | $4,345 | $370,100 | $206,300 | $163,800 |
| 2022 | $4,124 | $321,400 | $181,500 | $139,900 |
| 2021 | $3,734 | $270,600 | $140,300 | $130,300 |
| 2020 | $3,685 | $257,700 | $132,000 | $125,700 |
| 2019 | $3,666 | $241,200 | $115,500 | $125,700 |
| 2018 | $3,859 | $241,200 | $115,500 | $125,700 |
| 2017 | $3,753 | $215,100 | $99,000 | $116,100 |
| 2016 | $3,204 | $184,900 | $78,400 | $106,500 |
| 2015 | $3,171 | $184,900 | $78,400 | $106,500 |
| 2014 | $2,917 | $156,000 | $56,100 | $99,900 |
Source: Public Records
Map
Nearby Homes
- 100 Burpee Rd
- 44 Cherry St Unit 2
- 29-31 Essex Ave Unit 2
- 106 Norfolk Ave
- 80 Norfolk Ave Unit 1
- 59 Essex St Unit 59B
- 76 Stetson Ave
- 189 Burrill St Unit 2
- 150 Windsor Ave
- 9 Sampson Ave
- 25 E Park Ave
- 35 Columbia Ave
- 51 Barnstable St
- 133 Eastern Ave Unit 8
- 44 Valley Rd
- 98 Paradise Rd
- 30 Paradise Rd
- 31 Madison St
- 26 Groveland St
- 30 Clifton Ave
- 49 Jessie St
- 57 Jessie St
- 57 Jessie St Unit 1st Floor
- 59 Jessie St Unit 2
- 59 Jessie St Unit 1
- 15 Highland Place
- 45 Jessie St
- 21 Highland Place
- 11 Highland Place
- 50 Jessie St
- 56 Jessie St Unit 2
- 56 Jessie St Unit 1
- 56 Jessie St
- 48 Jessie St
- 0 Foster Rd
- 38 Jessie St
- 80 Roy St
- 60 Buena Vista St
- 66 Buena Vista St
- 84 Roy St