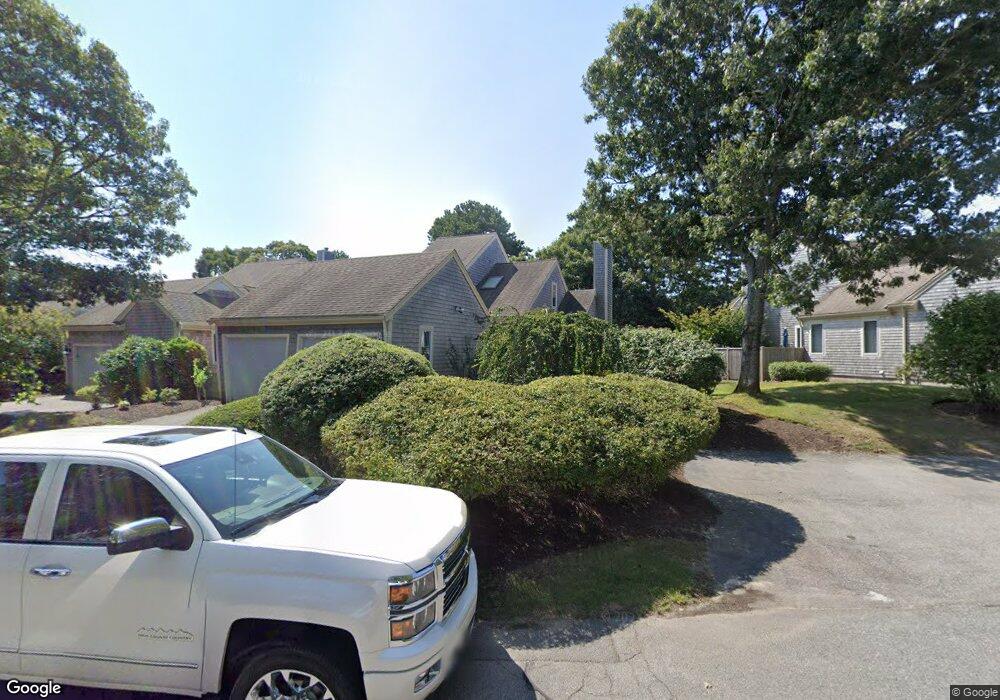
53 Kates Path Yarmouth Port, MA 02675
Yarmouth Port NeighborhoodEstimated Value: $690,000 - $728,000
2
Beds
4
Baths
1,609
Sq Ft
$440/Sq Ft
Est. Value
About This Home
This home is located at 53 Kates Path, Yarmouth Port, MA 02675 and is currently estimated at $708,307, approximately $440 per square foot. 53 Kates Path is a home located in Barnstable County with nearby schools including Dennis-Yarmouth Regional High School.
Ownership History
Date
Name
Owned For
Owner Type
Purchase Details
Closed on
Aug 5, 2020
Sold by
Gapstur Anna A
Bought by
Anna Alicia Gapstur T and Anna Gapstur
Current Estimated Value
Home Financials for this Owner
Home Financials are based on the most recent Mortgage that was taken out on this home.
Original Mortgage
$206,000
Outstanding Balance
$181,912
Interest Rate
3%
Mortgage Type
New Conventional
Estimated Equity
$526,395
Purchase Details
Closed on
Jan 19, 2017
Sold by
Gapstur Anna A
Bought by
Anna Alicia Gapstur T and Anna Gapstur
Purchase Details
Closed on
Jun 8, 2016
Sold by
Nelson Harold B and Nelson Claire B
Bought by
Gapstur Anna A
Purchase Details
Closed on
Jul 20, 2012
Sold by
Gurrier Elizabeth Est and Gurrier
Bought by
Nelson Harold B and Nelson Claire B
Purchase Details
Closed on
Oct 30, 2002
Sold by
Kane John F
Bought by
Gurrier Elizabeth S
Purchase Details
Closed on
Nov 19, 1992
Sold by
Gorgone Francis P and Gorgone Linda A
Bought by
Kane John F and Kane Mary M
Home Financials for this Owner
Home Financials are based on the most recent Mortgage that was taken out on this home.
Original Mortgage
$130,000
Interest Rate
7.95%
Mortgage Type
Purchase Money Mortgage
Create a Home Valuation Report for This Property
The Home Valuation Report is an in-depth analysis detailing your home's value as well as a comparison with similar homes in the area
Home Values in the Area
Average Home Value in this Area
Purchase History
| Date | Buyer | Sale Price | Title Company |
|---|---|---|---|
| Anna Alicia Gapstur T | -- | None Available | |
| Gapstur Anna A | -- | None Available | |
| Anna Alicia Gapstur T | -- | -- | |
| Gapstur Anna A | $402,500 | -- | |
| Nelson Harold B | $348,000 | -- | |
| Nelson Harold B | $348,000 | -- | |
| Nelson Harold B | $348,000 | -- | |
| Gurrier Elizabeth S | $375,000 | -- | |
| Gurrier Elizabeth S | $375,000 | -- | |
| Kane John F | $215,000 | -- |
Source: Public Records
Mortgage History
| Date | Status | Borrower | Loan Amount |
|---|---|---|---|
| Open | Gapstur Anna A | $206,000 | |
| Previous Owner | Gurrier Elizabeth S | $50,000 | |
| Previous Owner | Kane John F | $130,000 | |
| Closed | Nelson Harold B | $0 |
Source: Public Records
Tax History Compared to Growth
Tax History
| Year | Tax Paid | Tax Assessment Tax Assessment Total Assessment is a certain percentage of the fair market value that is determined by local assessors to be the total taxable value of land and additions on the property. | Land | Improvement |
|---|---|---|---|---|
| 2025 | $4,263 | $602,100 | $0 | $602,100 |
| 2024 | $4,283 | $580,400 | $0 | $580,400 |
| 2023 | $3,861 | $476,100 | $0 | $476,100 |
| 2022 | $4,408 | $480,200 | $0 | $480,200 |
| 2021 | $4,291 | $448,900 | $0 | $448,900 |
| 2020 | $4,332 | $433,200 | $0 | $433,200 |
| 2019 | $4,064 | $402,400 | $0 | $402,400 |
| 2018 | $3,824 | $371,600 | $0 | $371,600 |
| 2017 | $3,569 | $356,200 | $0 | $356,200 |
| 2016 | $3,401 | $340,800 | $0 | $340,800 |
| 2015 | $3,595 | $358,100 | $0 | $358,100 |
Source: Public Records
Map
Nearby Homes
- 228 Kates Path
- 17 Kates Path Unit A
- 64 Kates Path
- 50 John Hall Cartway
- 50 John Hall Cartway Unit 50
- 34 Kates Path
- 34 Kates Path Unit 34
- 42 John Hall Cartway Unit 42
- 7 Forest Gate Unit 7
- 30 W Woods
- 30 W Woods Cir Unit 30
- 43 Canterbury Rd
- 25 Oak Glen Village Unit 25
- 25 Oak Glen
- 2 Pine Grove
- 44 Stratford Ln
- 51 Bray Farm Rd N
- 86 Pompano Rd
- 6 Nimble Hill Dr
- 59 Main St Unit 19-2
- 51 Kates Path
- 49 Kates Path
- 47 Kates Path
- 45 Kates Path
- 43 Kates Path
- 47 Kates Path Unit 47-B
- 45 Kates Path Unit C45
- 53 Kate's Path
- 53 Kate's Point Unit 53
- 43 Kates Path Unit 43
- 51 Kates Path Unit A
- 43 Kates Path Unit H
- 53 Kates Path Unit D
- 61 Kates Path
- 59 Kates Path
- 57 Kates Path
- 55 Kates Path
- 61 Kates Path Unit A
- 59 Kate's Path Unit 59
- 57 Kates Path Unit 57