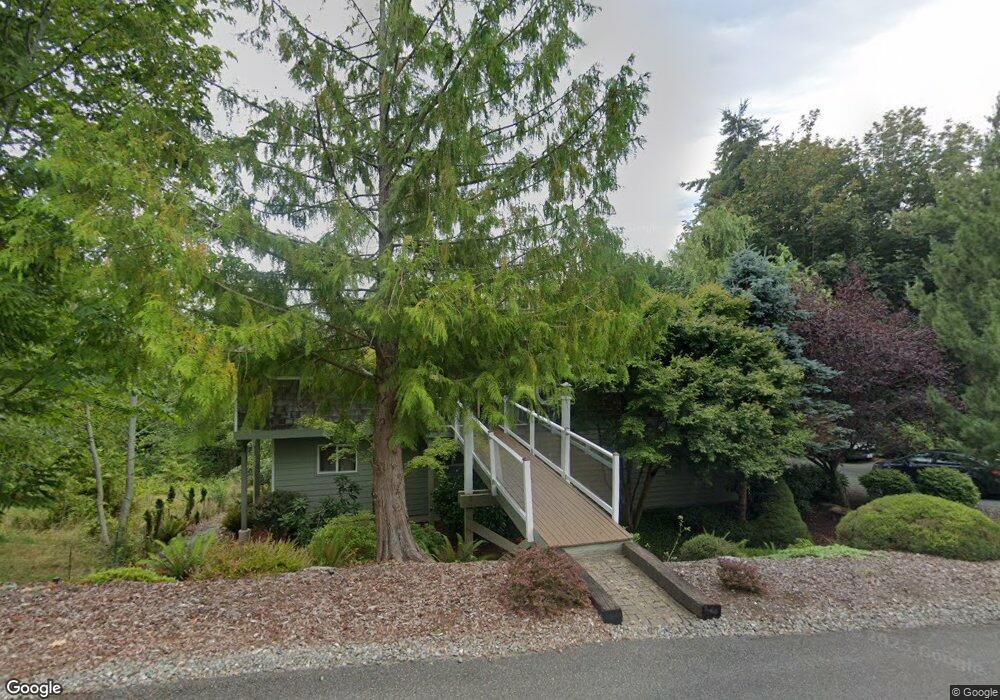
53 Keller Ln Port Ludlow, WA 98365
Port Ludlow NeighborhoodEstimated Value: $554,037 - $638,000
3
Beds
3
Baths
1,884
Sq Ft
$314/Sq Ft
Est. Value
About This Home
This home is located at 53 Keller Ln, Port Ludlow, WA 98365 and is currently estimated at $592,509, approximately $314 per square foot. 53 Keller Ln is a home located in Jefferson County with nearby schools including Chimacum Creek Primary School, Chimacum School Pi Program, and Chimacum Elementary School.
Ownership History
Date
Name
Owned For
Owner Type
Purchase Details
Closed on
May 16, 2023
Sold by
Smith Curtis Gene
Bought by
Newkirk-Smith Family Trust
Current Estimated Value
Home Financials for this Owner
Home Financials are based on the most recent Mortgage that was taken out on this home.
Original Mortgage
$322,500
Outstanding Balance
$311,033
Interest Rate
6.28%
Mortgage Type
Balloon
Estimated Equity
$281,476
Purchase Details
Closed on
Mar 4, 2016
Sold by
Smith Curtis Gene and Newkirk Smith Mishele Ray
Bought by
Smith Curtis Gene and Smith Mishele Ray Newkirk
Home Financials for this Owner
Home Financials are based on the most recent Mortgage that was taken out on this home.
Original Mortgage
$231,880
Interest Rate
3.72%
Mortgage Type
VA
Purchase Details
Closed on
Aug 7, 2008
Sold by
Smith Curtis Gene and Newkirk Smith Mishele Ray
Bought by
Smith Curtis Gene and Newkirk Smith Mishele Ray
Create a Home Valuation Report for This Property
The Home Valuation Report is an in-depth analysis detailing your home's value as well as a comparison with similar homes in the area
Home Values in the Area
Average Home Value in this Area
Purchase History
| Date | Buyer | Sale Price | Title Company |
|---|---|---|---|
| Newkirk-Smith Family Trust | -- | None Listed On Document | |
| Smith Curtis G | -- | None Listed On Document | |
| Smith Curtis Gene | -- | None Available | |
| Smith Curtis Gene | -- | None Available | |
| Smith Curtis Gene | $280 | None Available | |
| Smith Curtis Gene | $280 | None Available | |
| Smith Curtis Gene | -- | None Available |
Source: Public Records
Mortgage History
| Date | Status | Borrower | Loan Amount |
|---|---|---|---|
| Open | Smith Curtis G | $322,500 | |
| Previous Owner | Smith Curtis Gene | $231,880 |
Source: Public Records
Tax History Compared to Growth
Tax History
| Year | Tax Paid | Tax Assessment Tax Assessment Total Assessment is a certain percentage of the fair market value that is determined by local assessors to be the total taxable value of land and additions on the property. | Land | Improvement |
|---|---|---|---|---|
| 2024 | $3,390 | $450,088 | $99,750 | $350,338 |
| 2023 | $3,390 | $425,740 | $90,000 | $335,740 |
| 2022 | $3,127 | $406,143 | $85,000 | $321,143 |
| 2021 | $2,997 | $339,308 | $58,500 | $280,808 |
| 2020 | $2,870 | $305,608 | $45,600 | $260,008 |
| 2019 | $2,728 | $281,007 | $41,800 | $239,207 |
| 2018 | $2,824 | $268,707 | $39,900 | $228,807 |
| 2017 | $2,670 | $246,006 | $38,000 | $208,006 |
| 2016 | $2,607 | $235,606 | $38,000 | $197,606 |
| 2015 | $2,600 | $227,403 | $75,038 | $152,365 |
| 2014 | -- | $227,403 | $75,038 | $152,365 |
| 2013 | -- | $197,740 | $65,250 | $132,490 |
Source: Public Records
Map
Nearby Homes
- 130 Baldwin Ln
- 155 Baldwin Ln
- 110 Cressey Ln
- 142 Resolute Ln
- 21 Camano Ln
- 37 Jackson Ln
- 61 Olympic Ln
- 140 Admiralty Ln Unit 370
- 23 Machias Loop
- 381 Rainier Ln
- Ponderosa Plan at Olympic Terrace
- Daniel Plan at Olympic Terrace
- 31 McCartney Peak Ln Unit 76
- Decker Plan at Olympic Terrace
- 291 Pioneer Dr
- 1 Pintail Rd
- 91 Drew Ln
- 639 Rainier Ln
- 103 Wells Ridge Ct
- 181 N Bay Ln Unit 6