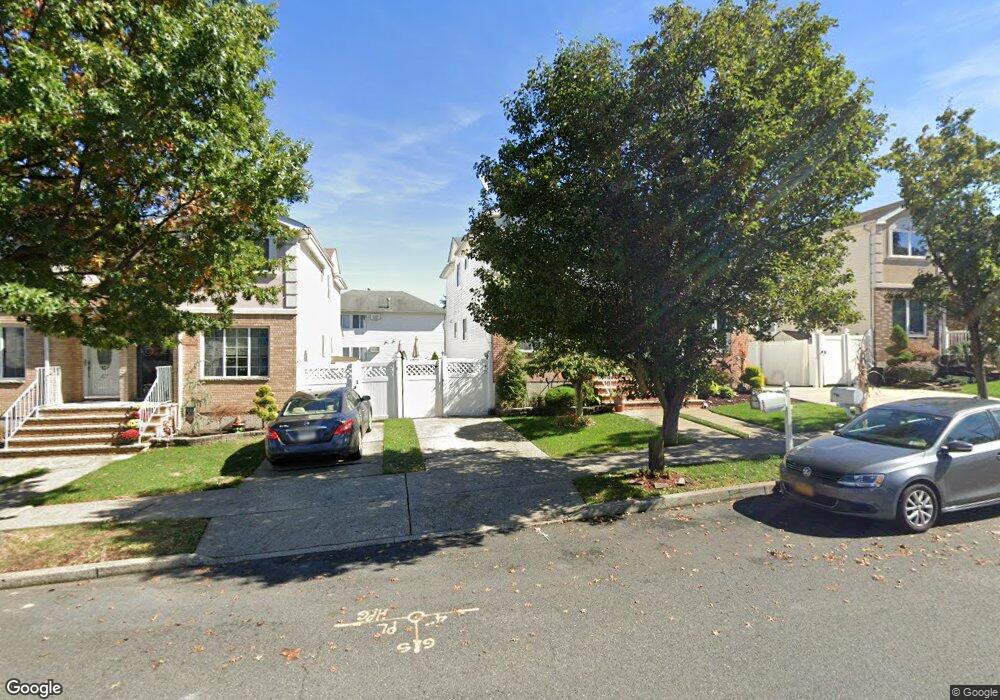
53 Kenilworth Ave Staten Island, NY 10312
Arden Heights NeighborhoodEstimated Value: $701,000 - $790,000
3
Beds
3
Baths
2,184
Sq Ft
$348/Sq Ft
Est. Value
About This Home
This home is located at 53 Kenilworth Ave, Staten Island, NY 10312 and is currently estimated at $760,136, approximately $348 per square foot. 53 Kenilworth Ave is a home located in Richmond County with nearby schools including P.S. 58R Space Shuttle Columbia School, I.S. 075 Frank D. Paulo, and Tottenville High School.
Ownership History
Date
Name
Owned For
Owner Type
Purchase Details
Closed on
Jul 31, 2007
Sold by
Oconnor Dennis and Oconnor Kathleen
Bought by
Ibrahim Ashraf
Current Estimated Value
Home Financials for this Owner
Home Financials are based on the most recent Mortgage that was taken out on this home.
Original Mortgage
$380,688
Outstanding Balance
$241,156
Interest Rate
6.67%
Mortgage Type
Purchase Money Mortgage
Estimated Equity
$518,980
Purchase Details
Closed on
May 27, 2004
Sold by
Neis Karen
Bought by
Oconnor Dennis and Oconnor Kathleen
Home Financials for this Owner
Home Financials are based on the most recent Mortgage that was taken out on this home.
Original Mortgage
$328,000
Interest Rate
5.75%
Mortgage Type
Purchase Money Mortgage
Purchase Details
Closed on
Jun 17, 2002
Sold by
Rokhsar Anoushiravan and Rokhsar Amanollah
Bought by
Neis Karen
Home Financials for this Owner
Home Financials are based on the most recent Mortgage that was taken out on this home.
Original Mortgage
$210,000
Interest Rate
6.82%
Create a Home Valuation Report for This Property
The Home Valuation Report is an in-depth analysis detailing your home's value as well as a comparison with similar homes in the area
Home Values in the Area
Average Home Value in this Area
Purchase History
| Date | Buyer | Sale Price | Title Company |
|---|---|---|---|
| Ibrahim Ashraf | $475,860 | None Available | |
| Oconnor Dennis | $410,000 | Commonwealth Land Title Insu | |
| Neis Karen | $229,028 | Commonwealth Land Title Ins |
Source: Public Records
Mortgage History
| Date | Status | Borrower | Loan Amount |
|---|---|---|---|
| Open | Ibrahim Ashraf | $380,688 | |
| Previous Owner | Oconnor Dennis | $328,000 | |
| Previous Owner | Neis Karen | $210,000 |
Source: Public Records
Tax History Compared to Growth
Tax History
| Year | Tax Paid | Tax Assessment Tax Assessment Total Assessment is a certain percentage of the fair market value that is determined by local assessors to be the total taxable value of land and additions on the property. | Land | Improvement |
|---|---|---|---|---|
| 2025 | $5,935 | $47,940 | $4,547 | $43,393 |
| 2024 | $5,935 | $39,180 | $5,249 | $33,931 |
| 2023 | $5,951 | $29,304 | $5,058 | $24,246 |
| 2022 | $5,850 | $36,480 | $6,960 | $29,520 |
| 2021 | $5,823 | $37,860 | $6,960 | $30,900 |
| 2020 | $5,525 | $32,640 | $6,960 | $25,680 |
| 2019 | $5,151 | $33,840 | $6,960 | $26,880 |
| 2018 | $4,978 | $24,420 | $6,960 | $17,460 |
| 2017 | $4,982 | $24,439 | $6,083 | $18,356 |
| 2016 | $4,609 | $23,056 | $6,234 | $16,822 |
| 2015 | $3,938 | $21,751 | $5,480 | $16,271 |
| 2014 | $3,938 | $20,520 | $5,820 | $14,700 |
Source: Public Records
Map
Nearby Homes
- 48 Hinton St
- 65 Benson St
- 46 Bianca Ct
- 19 Benson St
- 26 Aspen Knolls Way
- 34 Jamie Ln
- 1192 Arthur Kill Rd
- 185 Aspen Knolls Way
- 49 Jamie Ln
- 171 Aspen Knolls Way
- 78 Amanda Ct
- 270 Aspen Knolls Way
- 46 Billings St
- 384 Aspen Knolls Way
- 192 Jamie Ln
- 111 Gary St
- 400 Aspen Knolls Way Unit B2
- 263 Jamie Ln
- 287 Jamie Ln
- 45 Ilyssa Way
- 49 Kenilworth Ave
- 55 Kenilworth Ave
- 59 Kenilworth Ave
- 47 Kenilworth Ave
- 50 Benson St
- 59 Benson St
- 61 Kenilworth Ave
- 48 Benson St
- 65 Kenilworth Ave
- 53 Hinton St
- 46 Benson St
- 51 Hinton St
- 67 Kenilworth Ave
- 47 Hinton St Unit 51
- 47-51 Hinton St
- 40 Benson St
- 52 Kenilworth Ave
- 48 Kenilworth Ave
- 54 Kenilworth Ave Unit 56
- 54-56 Kenilworth Ave