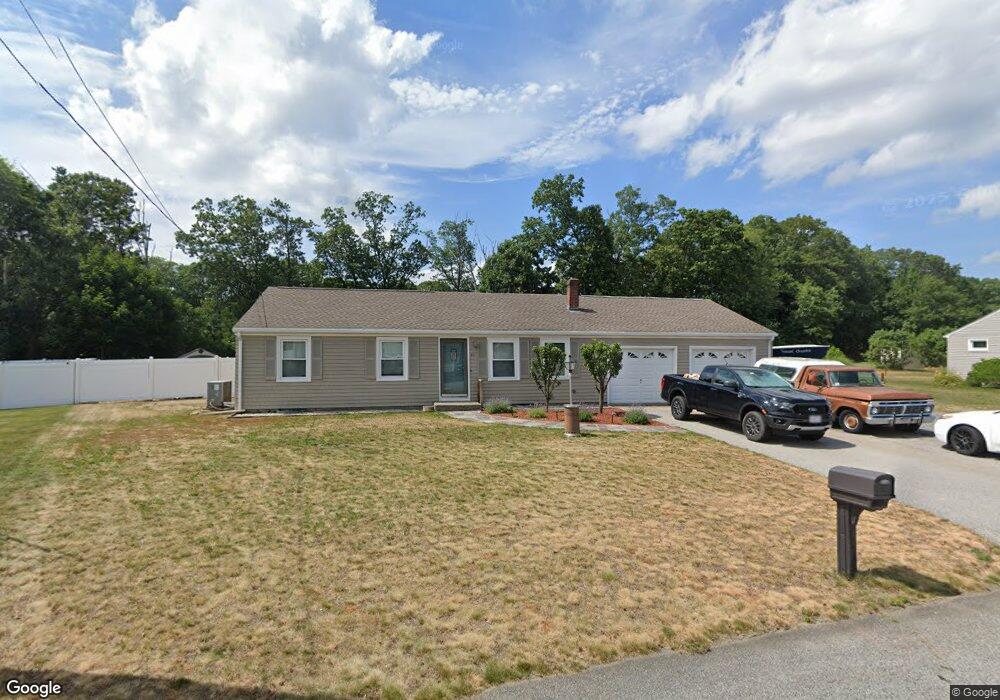
53 Kent Dr Seekonk, MA 02771
Estimated Value: $511,000 - $547,000
3
Beds
1
Bath
1,312
Sq Ft
$405/Sq Ft
Est. Value
About This Home
This home is located at 53 Kent Dr, Seekonk, MA 02771 and is currently estimated at $531,340, approximately $404 per square foot. 53 Kent Dr is a home located in Bristol County with nearby schools including Seekonk High School, St Cecilia School, and Saint Teresa Catholic Elementary School.
Ownership History
Date
Name
Owned For
Owner Type
Purchase Details
Closed on
May 16, 2018
Sold by
Tobin John L
Bought by
Tobin Christine T and Tobin John L
Current Estimated Value
Purchase Details
Closed on
Jun 29, 2012
Sold by
Tobin-Henry Kathleen and Norton Eileen
Bought by
Tobin John L
Purchase Details
Closed on
Jun 30, 2009
Sold by
Tobin John L
Bought by
Tobin-Henry Kathleen and Tobin John L
Purchase Details
Closed on
Aug 9, 2006
Sold by
Boyce Michael R and Boyce Dorothy O
Bought by
Tobin John L and Tobin Jane F
Create a Home Valuation Report for This Property
The Home Valuation Report is an in-depth analysis detailing your home's value as well as a comparison with similar homes in the area
Home Values in the Area
Average Home Value in this Area
Purchase History
| Date | Buyer | Sale Price | Title Company |
|---|---|---|---|
| Tobin Christine T | -- | -- | |
| Tobin John L | -- | -- | |
| Tobin-Henry Kathleen | -- | -- | |
| Tobin John L | $3,800 | -- |
Source: Public Records
Tax History Compared to Growth
Tax History
| Year | Tax Paid | Tax Assessment Tax Assessment Total Assessment is a certain percentage of the fair market value that is determined by local assessors to be the total taxable value of land and additions on the property. | Land | Improvement |
|---|---|---|---|---|
| 2025 | $5,718 | $463,000 | $189,900 | $273,100 |
| 2024 | $5,296 | $428,800 | $172,200 | $256,600 |
| 2023 | $5,116 | $390,200 | $155,600 | $234,600 |
| 2022 | $4,689 | $351,500 | $150,600 | $200,900 |
| 2021 | $4,526 | $333,500 | $136,200 | $197,300 |
| 2020 | $4,282 | $325,100 | $136,200 | $188,900 |
| 2019 | $3,853 | $295,000 | $115,100 | $179,900 |
| 2018 | $3,368 | $252,300 | $89,700 | $162,600 |
| 2017 | $3,318 | $246,500 | $89,700 | $156,800 |
| 2016 | $3,182 | $237,300 | $89,700 | $147,600 |
| 2015 | $3,112 | $235,200 | $89,700 | $145,500 |
Source: Public Records
Map
Nearby Homes
- 87 Baker St
- 1150 Newman Ave
- 245 Manton St
- 245 Manton St Unit 83
- 91 Seabiscuit Place
- 242 St
- 242 Manton #41 St
- 63 Whirlaway Place
- 728 Beverage Hill Ave Unit 24
- 618 Armistice Blvd
- 104 Crescent Rd
- 724 Beverage Hill Ave Unit 302
- 329 Pullen Ave
- 400 Newport Ave
- 95 Federal St
- 38 Lowell Ave
- 127 Ricard St
- 66 1st St
- 252 Williston Way
- 50 Dexter Ave