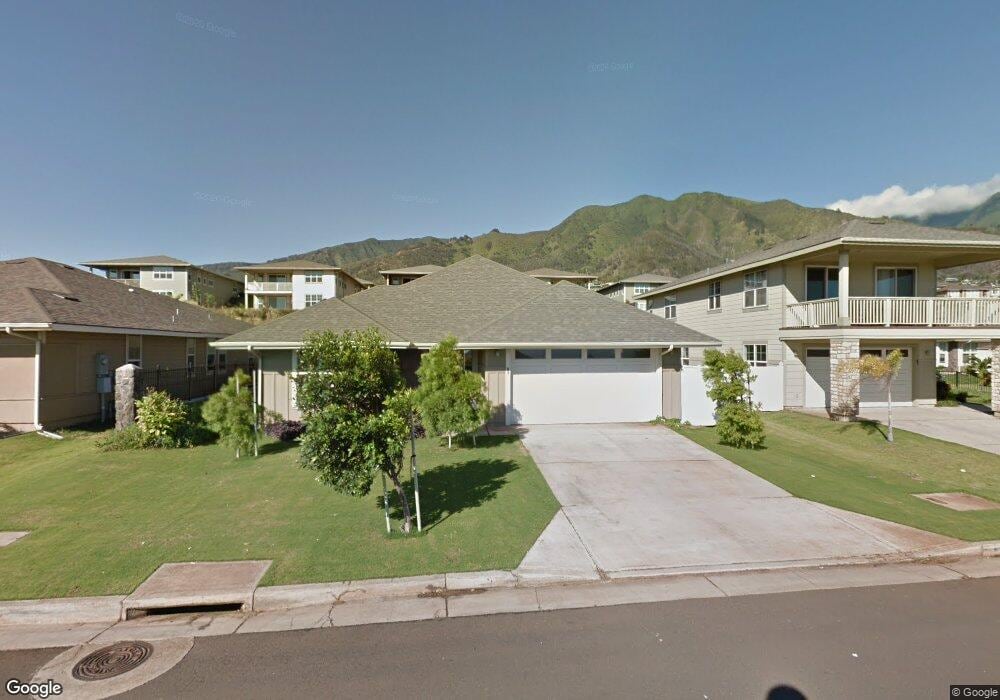
53 Kumulipo Place Unit Lot 18 Wailuku, HI 96793
Estimated Value: $1,342,732 - $1,428,000
3
Beds
3
Baths
1,963
Sq Ft
$712/Sq Ft
Est. Value
About This Home
This home is located at 53 Kumulipo Place Unit Lot 18, Wailuku, HI 96793 and is currently estimated at $1,396,933, approximately $711 per square foot. 53 Kumulipo Place Unit Lot 18 is a home located in Maui County with nearby schools including Puu Kukui Elementary School, Iao Intermediate School, and Henry Perrine Baldwin High School.
Ownership History
Date
Name
Owned For
Owner Type
Purchase Details
Closed on
Apr 23, 2015
Sold by
Sarchet Dylan S and Sarchet Jill M
Bought by
Sarchet Dylan S and Sarchet Jill M
Current Estimated Value
Home Financials for this Owner
Home Financials are based on the most recent Mortgage that was taken out on this home.
Original Mortgage
$505,000
Outstanding Balance
$387,340
Interest Rate
3.64%
Mortgage Type
New Conventional
Estimated Equity
$1,009,593
Purchase Details
Closed on
Sep 10, 2009
Sold by
Akolea At Kehalani Llc
Bought by
Sarchet Dylan S and Sarchet Jill M
Home Financials for this Owner
Home Financials are based on the most recent Mortgage that was taken out on this home.
Original Mortgage
$547,009
Interest Rate
4.92%
Mortgage Type
FHA
Create a Home Valuation Report for This Property
The Home Valuation Report is an in-depth analysis detailing your home's value as well as a comparison with similar homes in the area
Home Values in the Area
Average Home Value in this Area
Purchase History
| Date | Buyer | Sale Price | Title Company |
|---|---|---|---|
| Sarchet Dylan S | -- | Or | |
| Sarchet Dylan S | $557,100 | Tg |
Source: Public Records
Mortgage History
| Date | Status | Borrower | Loan Amount |
|---|---|---|---|
| Open | Sarchet Dylan S | $505,000 | |
| Previous Owner | Sarchet Dylan S | $547,009 |
Source: Public Records
Tax History Compared to Growth
Tax History
| Year | Tax Paid | Tax Assessment Tax Assessment Total Assessment is a certain percentage of the fair market value that is determined by local assessors to be the total taxable value of land and additions on the property. | Land | Improvement |
|---|---|---|---|---|
| 2025 | $1,204 | $1,142,500 | $571,400 | $571,100 |
| 2024 | $1,204 | $968,900 | $424,700 | $544,200 |
| 2023 | $1,271 | $969,200 | $424,700 | $544,500 |
| 2022 | $1,252 | $825,900 | $332,100 | $493,800 |
| 2021 | $1,442 | $798,300 | $339,800 | $458,500 |
| 2020 | $1,523 | $806,900 | $339,800 | $467,100 |
| 2019 | $1,608 | $754,600 | $301,200 | $453,400 |
| 2018 | $1,593 | $758,900 | $258,700 | $500,200 |
| 2017 | $1,510 | $0 | $0 | $0 |
| 2016 | $137 | $706,000 | $241,400 | $464,600 |
| 2015 | $548 | $632,100 | $232,800 | $399,300 |
| 2014 | $548 | $593,900 | $232,800 | $361,100 |
Source: Public Records
Map
Nearby Homes
- 160 Kinohi Loa Loop
- 67 Kinohi Loa Loop
- 21 Kamauhalii Way Unit 1A
- 563 Kauna Lipo Dr
- 629 Kauna Lipo Dr Unit 13
- 508 Kauna Lipo Dr Unit LOT 39
- 637 Kauna Lipo Dr Unit 14
- 673 Kauna Lipo Dr Unit 18
- 15 Kaloaloa Way Unit 7A
- 107 Kinohi Loa St
- 29 Maunaleo St
- 115 Nanu Place
- 116 Hopoi Place Unit 57
- 124 Hopoi Place
- 101 Hopo'I Place Unit 51B
- 33 Kokea St Unit 901
- 15 Awela Cir Unit 103
- Nahele (K9) Plan at Anuhea at Kehalani - Anuhea
- Hui'hui' (IK6) Plan at Anuhea at Kehalani - Anuhea
- Pali (IK8) Plan at Anuhea at Kehalani - Anuhea
- 53 Kumulipo Place
- 61 Kumulipo Place
- 61 Kumulipo Place Unit Lot 19
- 47 Kumulipo Place
- 47 Kumulipo Place Unit 17
- 41 Kumulipo Place
- 41 Kumulipo Place Unit Home Site 16
- 146 Kinohi Loa Loop
- 146 Kinohi Loa Loop Unit Home Site 26
- 154 Kinohi Loa Loop
- 154 Kinohi Loa Loop Unit Lot 25
- 142 Kinohi Loa Loop
- 142 Kinohi Loa Loop Unit Lot 27
- 67 Kumulipo Place
- 67 Kumulipo Place Unit Lot 20
- 75 Kumulipo Place
- 75 Kumulipo Place Unit Lot 21
- 33 Kumulipo Place
- 33 Kumulipo Place Unit Lot 15
- 4 Leoole Way