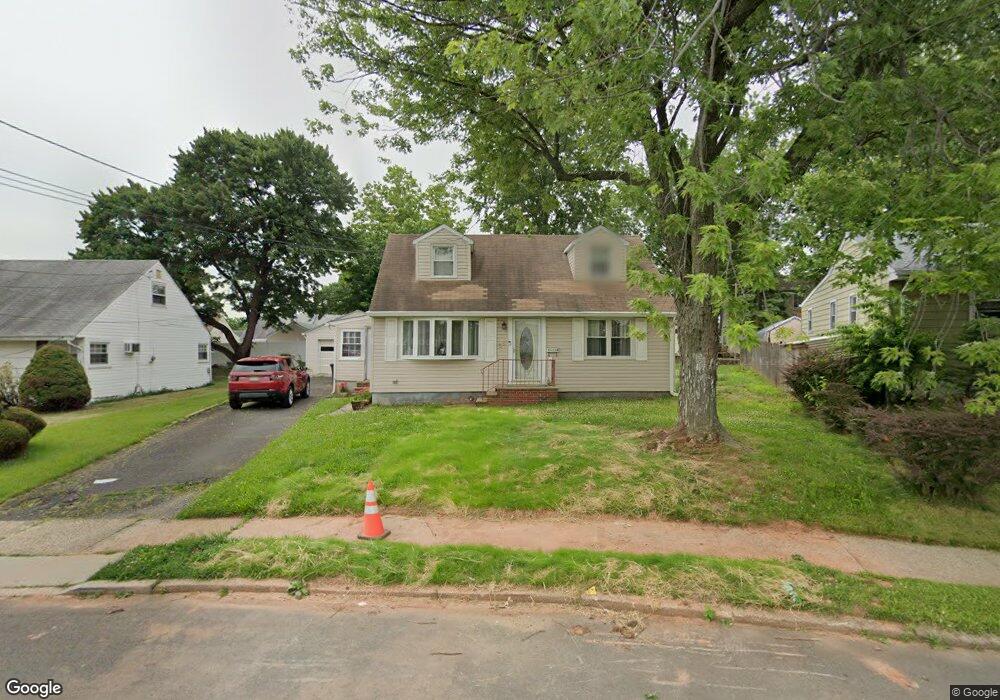
53 Laurel St Carteret, NJ 07008
Estimated Value: $456,000 - $542,000
Studio
--
Bath
1,228
Sq Ft
$409/Sq Ft
Est. Value
About This Home
This home is located at 53 Laurel St, Carteret, NJ 07008 and is currently estimated at $502,034, approximately $408 per square foot. 53 Laurel St is a home located in Middlesex County with nearby schools including Carteret High School and St Joseph School.
Ownership History
Date
Name
Owned For
Owner Type
Purchase Details
Closed on
Jul 26, 2002
Sold by
Reyes Iran
Bought by
Rampersad Steve and Rampersad Shana
Current Estimated Value
Home Financials for this Owner
Home Financials are based on the most recent Mortgage that was taken out on this home.
Original Mortgage
$161,852
Outstanding Balance
$68,488
Interest Rate
6.55%
Mortgage Type
FHA
Estimated Equity
$433,546
Purchase Details
Closed on
Jun 26, 1998
Sold by
Balka John
Bought by
Bravo Daniel and Reyes Iran
Home Financials for this Owner
Home Financials are based on the most recent Mortgage that was taken out on this home.
Original Mortgage
$94,200
Interest Rate
6.9%
Mortgage Type
FHA
Create a Home Valuation Report for This Property
The Home Valuation Report is an in-depth analysis detailing your home's value as well as a comparison with similar homes in the area
Home Values in the Area
Average Home Value in this Area
Purchase History
| Date | Buyer | Sale Price | Title Company |
|---|---|---|---|
| Rampersad Steve | $179,500 | -- | |
| Bravo Daniel | $95,000 | -- |
Source: Public Records
Mortgage History
| Date | Status | Borrower | Loan Amount |
|---|---|---|---|
| Open | Rampersad Steve | $161,852 | |
| Previous Owner | Bravo Daniel | $94,200 |
Source: Public Records
Tax History
| Year | Tax Paid | Tax Assessment Tax Assessment Total Assessment is a certain percentage of the fair market value that is determined by local assessors to be the total taxable value of land and additions on the property. | Land | Improvement |
|---|---|---|---|---|
| 2025 | $7,996 | $529,500 | $349,300 | $180,200 |
| 2024 | $7,790 | $250,800 | $140,500 | $110,300 |
| 2023 | $7,790 | $250,800 | $140,500 | $110,300 |
| 2022 | $7,574 | $250,800 | $140,500 | $110,300 |
| 2021 | $5,550 | $250,800 | $140,500 | $110,300 |
| 2020 | $7,213 | $250,800 | $140,500 | $110,300 |
| 2019 | $7,005 | $250,800 | $140,500 | $110,300 |
| 2018 | $6,839 | $250,800 | $140,500 | $110,300 |
| 2017 | $6,596 | $250,800 | $140,500 | $110,300 |
| 2016 | $6,499 | $205,200 | $105,500 | $99,700 |
| 2015 | $6,404 | $205,200 | $105,500 | $99,700 |
| 2014 | $6,125 | $205,200 | $105,500 | $99,700 |
Source: Public Records
Map
Nearby Homes
Your Personal Tour Guide
Ask me questions while you tour the home.