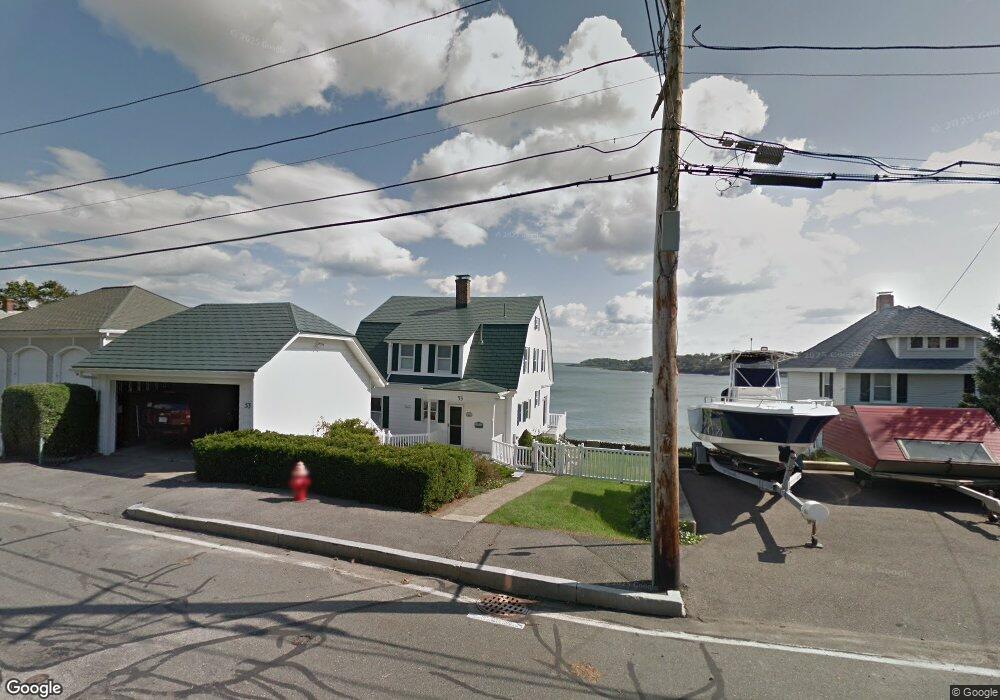
53 Little Nahant Rd Nahant, MA 01908
Estimated Value: $1,282,000 - $1,753,000
4
Beds
2
Baths
2,528
Sq Ft
$592/Sq Ft
Est. Value
About This Home
This home is located at 53 Little Nahant Rd, Nahant, MA 01908 and is currently estimated at $1,496,522, approximately $591 per square foot. 53 Little Nahant Rd is a home located in Essex County with nearby schools including Johnson Elementary School, Swampscott Middle School, and Swampscott High School.
Ownership History
Date
Name
Owned For
Owner Type
Purchase Details
Closed on
Mar 30, 2018
Sold by
Girard Paul A and Girard Patricia A
Bought by
Paul and Paul Patricia Girard
Current Estimated Value
Purchase Details
Closed on
Mar 7, 2016
Sold by
Girard Paul A
Bought by
Girard Paul A and Girard Patricia A
Purchase Details
Closed on
Nov 17, 2011
Sold by
Girard Paul A and Girard Marilyn R
Bought by
Girard Paul A
Home Financials for this Owner
Home Financials are based on the most recent Mortgage that was taken out on this home.
Original Mortgage
$938,250
Interest Rate
3.92%
Mortgage Type
Reverse Mortgage Home Equity Conversion Mortgage
Purchase Details
Closed on
Apr 21, 1998
Sold by
Elliott Elaine
Bought by
Girard Paul A
Home Financials for this Owner
Home Financials are based on the most recent Mortgage that was taken out on this home.
Original Mortgage
$100,000
Interest Rate
7.11%
Mortgage Type
Purchase Money Mortgage
Create a Home Valuation Report for This Property
The Home Valuation Report is an in-depth analysis detailing your home's value as well as a comparison with similar homes in the area
Home Values in the Area
Average Home Value in this Area
Purchase History
| Date | Buyer | Sale Price | Title Company |
|---|---|---|---|
| Paul | -- | -- | |
| Paul | -- | -- | |
| Girard Paul A | -- | -- | |
| Girard Paul A | -- | -- | |
| Girard Paul A | -- | -- | |
| Girard Paul A | -- | -- | |
| Girard Paul A | $360,000 | -- | |
| Girard Paul A | $360,000 | -- |
Source: Public Records
Mortgage History
| Date | Status | Borrower | Loan Amount |
|---|---|---|---|
| Previous Owner | Girard Paul A | $938,250 | |
| Previous Owner | Girard Paul A | $100,000 | |
| Closed | Girard Paul A | $40,000 |
Source: Public Records
Tax History Compared to Growth
Tax History
| Year | Tax Paid | Tax Assessment Tax Assessment Total Assessment is a certain percentage of the fair market value that is determined by local assessors to be the total taxable value of land and additions on the property. | Land | Improvement |
|---|---|---|---|---|
| 2025 | $13,186 | $1,441,100 | $983,400 | $457,700 |
| 2024 | $13,071 | $1,441,100 | $983,400 | $457,700 |
| 2023 | $12,810 | $1,409,200 | $964,700 | $444,500 |
| 2022 | $12,517 | $1,278,500 | $880,400 | $398,100 |
| 2021 | $12,185 | $1,159,400 | $786,800 | $372,600 |
| 2020 | $12,108 | $1,103,700 | $786,800 | $316,900 |
| 2019 | $10,947 | $1,003,400 | $721,200 | $282,200 |
| 2018 | $9,612 | $937,800 | $655,600 | $282,200 |
| 2017 | $9,819 | $937,800 | $655,600 | $282,200 |
| 2016 | $9,547 | $907,500 | $636,900 | $270,600 |
| 2015 | $9,220 | $844,300 | $578,400 | $265,900 |
| 2014 | -- | $844,300 | $578,400 | $265,900 |
Source: Public Records
Map
Nearby Homes
- 9 Little Nahant Rd
- 36 Lennox Rd
- 23 Phillips Rd
- 66 Ocean St
- 17 Pearl Rd
- 43 Maple Ave
- 2 Goddard Dr
- 303 Nahant Rd
- 183 Bass Point Rd
- 51 Cliff St
- 3 Cliff St
- 9 Beach Rd Unit 4
- 98 Lynnway Unit 102
- 45 Tudor St Unit 3-8
- 12 Chancery Ct Unit 205
- 12 Chancery Ct Unit 207
- 41 Tudor St
- 154 Lynnway Unit 520
- 154 Lynnway Unit 205
- 154 Lynnway Unit 213
- 51 Little Nahant Rd
- 49 Little Nahant Rd
- 57 Little Nahant Rd
- 52 Little Nahant Rd
- 46 Little Nahant Rd
- 59 Little Nahant Rd
- 42 Little Nahant Rd
- 42 Little Nahant Rd
- 42 Little Nahant Rd Unit 1
- 45 Little Nahant Rd
- 60 Little Nahant Rd
- 41 Little Nahant Rd
- 65 Little Nahant Rd
- 38 Little Nahant Rd
- 27 Baker Rd
- 62 Little Nahant Rd
- 62 Little Nahant Rd Unit 1
- 39 Little Nahant Rd
- 19 Baker Rd
- 10 Baker Rd