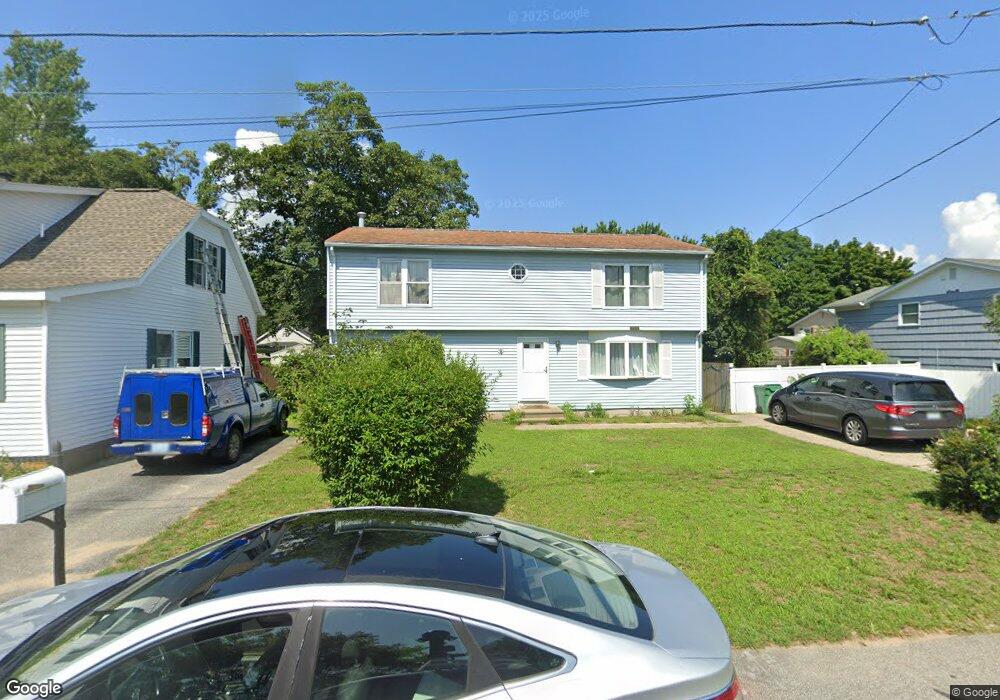
53 Lloyd Ave Warwick, RI 02889
Buttonwoods NeighborhoodEstimated Value: $419,000 - $506,000
4
Beds
2
Baths
1,960
Sq Ft
$241/Sq Ft
Est. Value
About This Home
This home is located at 53 Lloyd Ave, Warwick, RI 02889 and is currently estimated at $472,274, approximately $240 per square foot. 53 Lloyd Ave is a home located in Kent County with nearby schools including Saint Kevin School, St Rose Of Lima School, and Bishop Hendricken High School.
Ownership History
Date
Name
Owned For
Owner Type
Purchase Details
Closed on
Feb 28, 2025
Sold by
Drammeh Jahou
Bought by
Faye Dethie and Leye Sokhna
Current Estimated Value
Home Financials for this Owner
Home Financials are based on the most recent Mortgage that was taken out on this home.
Original Mortgage
$417,302
Outstanding Balance
$413,458
Interest Rate
7.04%
Mortgage Type
FHA
Estimated Equity
$58,817
Purchase Details
Closed on
May 1, 2007
Sold by
James Barbara J
Bought by
Drammeh Jahou
Home Financials for this Owner
Home Financials are based on the most recent Mortgage that was taken out on this home.
Original Mortgage
$235,000
Interest Rate
6.18%
Mortgage Type
Purchase Money Mortgage
Purchase Details
Closed on
Dec 18, 2001
Sold by
Larose Harry E and Larose Sharon L
Bought by
James Barbara J
Create a Home Valuation Report for This Property
The Home Valuation Report is an in-depth analysis detailing your home's value as well as a comparison with similar homes in the area
Home Values in the Area
Average Home Value in this Area
Purchase History
We collect this data history from publicly available records. To have your information removed, we recommend requesting removal directly through your county’s website.
| Date | Buyer | Sale Price | Title Company |
|---|---|---|---|
| Faye Dethie | $425,000 | None Available | |
| Faye Dethie | $425,000 | None Available | |
| Drammeh Jahou | $235,000 | -- | |
| Drammeh Jahou | $235,000 | -- | |
| James Barbara J | $147,000 | -- | |
| James Barbara J | $147,000 | -- |
Source: Public Records
Mortgage History
We collect this data history from publicly available records. To have your information removed, we recommend requesting removal directly through your county’s website.
| Date | Status | Borrower | Loan Amount |
|---|---|---|---|
| Open | Faye Dethie | $417,302 | |
| Closed | Faye Dethie | $417,302 | |
| Previous Owner | James Barbara J | $235,000 |
Source: Public Records
Tax History
| Year | Tax Paid | Tax Assessment Tax Assessment Total Assessment is a certain percentage of the fair market value that is determined by local assessors to be the total taxable value of land and additions on the property. | Land | Improvement |
|---|---|---|---|---|
| 2025 | $5,850 | $460,600 | $101,600 | $359,000 |
| 2024 | $5,273 | $364,400 | $88,400 | $276,000 |
| 2023 | $5,171 | $364,400 | $88,400 | $276,000 |
| 2022 | $5,089 | $271,700 | $56,600 | $215,100 |
| 2021 | $5,089 | $271,700 | $56,600 | $215,100 |
| 2020 | $5,089 | $271,700 | $56,600 | $215,100 |
| 2019 | $5,089 | $271,700 | $56,600 | $215,100 |
| 2018 | $4,690 | $225,500 | $53,400 | $172,100 |
| 2017 | $4,564 | $225,500 | $53,400 | $172,100 |
| 2016 | $4,564 | $225,500 | $53,400 | $172,100 |
| 2015 | $4,544 | $219,000 | $55,400 | $163,600 |
| 2014 | $4,393 | $219,000 | $55,400 | $163,600 |
| 2013 | $4,334 | $219,000 | $55,400 | $163,600 |
Source: Public Records
Map
Nearby Homes
- 200 Glen Dr
- 109 Hawksley Ave
- 131 Canfield Ave
- 60 Tampa Ave
- 165 Canfield Ave
- 171 Canfield Ave
- 78 Shand Ave
- 176 Horse Neck Rd
- 26 Limestone St
- 195 Oakland Beach Ave
- 79 Pinehurst Ave
- 31 Oakhurst Ave
- 188 Wood St
- 40 Northup St
- 1 Willow Glen Cir Unit 25
- 1 Willow Glen Cir Unit 106
- 700 Sandy Ln Unit 3
- 700 Sandy Ln Unit 5
- 700 Sandy Ln Unit 19
- 700 Sandy Ln Unit 20
Your Personal Tour Guide
Ask me questions while you tour the home.