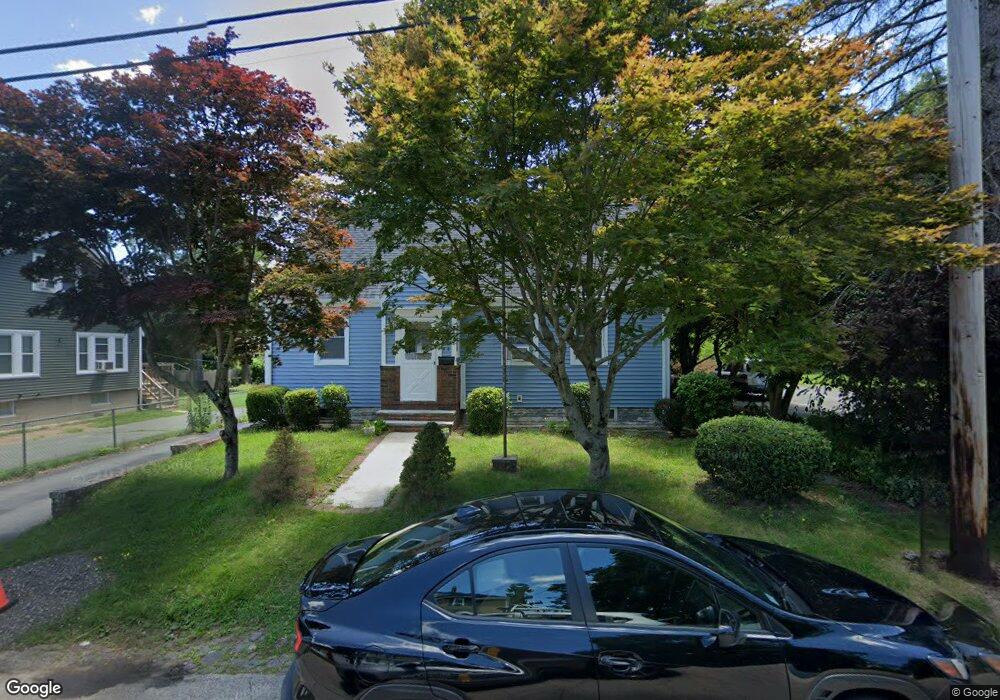
53 Locust St Brockton, MA 02301
Montello NeighborhoodEstimated Value: $476,000 - $487,000
3
Beds
2
Baths
1,333
Sq Ft
$360/Sq Ft
Est. Value
About This Home
This home is located at 53 Locust St, Brockton, MA 02301 and is currently estimated at $479,695, approximately $359 per square foot. 53 Locust St is a home located in Plymouth County with nearby schools including Raymond K-8 Elementary School, Louis F Angelo Elementary School, and Manthala George Jr. School.
Ownership History
Date
Name
Owned For
Owner Type
Purchase Details
Closed on
Jun 24, 2011
Sold by
Zamaitis Ralph S
Bought by
Johnson Eryka L and Ayano Martha
Current Estimated Value
Home Financials for this Owner
Home Financials are based on the most recent Mortgage that was taken out on this home.
Original Mortgage
$166,650
Outstanding Balance
$114,831
Interest Rate
4.62%
Mortgage Type
FHA
Estimated Equity
$364,864
Create a Home Valuation Report for This Property
The Home Valuation Report is an in-depth analysis detailing your home's value as well as a comparison with similar homes in the area
Home Values in the Area
Average Home Value in this Area
Purchase History
| Date | Buyer | Sale Price | Title Company |
|---|---|---|---|
| Johnson Eryka L | $190,000 | -- |
Source: Public Records
Mortgage History
| Date | Status | Borrower | Loan Amount |
|---|---|---|---|
| Open | Johnson Eryka L | $166,650 |
Source: Public Records
Tax History Compared to Growth
Tax History
| Year | Tax Paid | Tax Assessment Tax Assessment Total Assessment is a certain percentage of the fair market value that is determined by local assessors to be the total taxable value of land and additions on the property. | Land | Improvement |
|---|---|---|---|---|
| 2025 | $5,030 | $415,400 | $140,100 | $275,300 |
| 2024 | $4,707 | $391,600 | $140,100 | $251,500 |
| 2023 | $4,492 | $346,100 | $104,200 | $241,900 |
| 2022 | $4,389 | $314,200 | $94,700 | $219,500 |
| 2021 | $3,970 | $273,800 | $78,700 | $195,100 |
| 2020 | $4,097 | $270,400 | $73,700 | $196,700 |
| 2019 | $3,997 | $257,200 | $71,900 | $185,300 |
| 2018 | $3,927 | $244,500 | $71,900 | $172,600 |
| 2017 | $3,363 | $208,900 | $71,900 | $137,000 |
| 2016 | $3,373 | $194,300 | $69,700 | $124,600 |
| 2015 | $3,042 | $167,600 | $69,700 | $97,900 |
| 2014 | $2,928 | $161,500 | $69,700 | $91,800 |
Source: Public Records
Map
Nearby Homes
- 11 Winsten St
- 932 N Main St Unit 5
- 863 N Main St
- 41 Martland Ave
- 25 Merritt Ave
- 279 Howard St
- 24 Oak St
- 706 W Main St
- 105 Oscar Ave
- 221 Oak St Unit 8-12
- 20 Johnson Ct
- 60 Bonney St
- 47 Beech Rd
- 178 Oak St
- 51 Colantha Ave
- 737 N Montello St
- 731 N Montello St Unit 6
- 235 Oak St
- 77 Porter St
- 200 Sawtell Ave