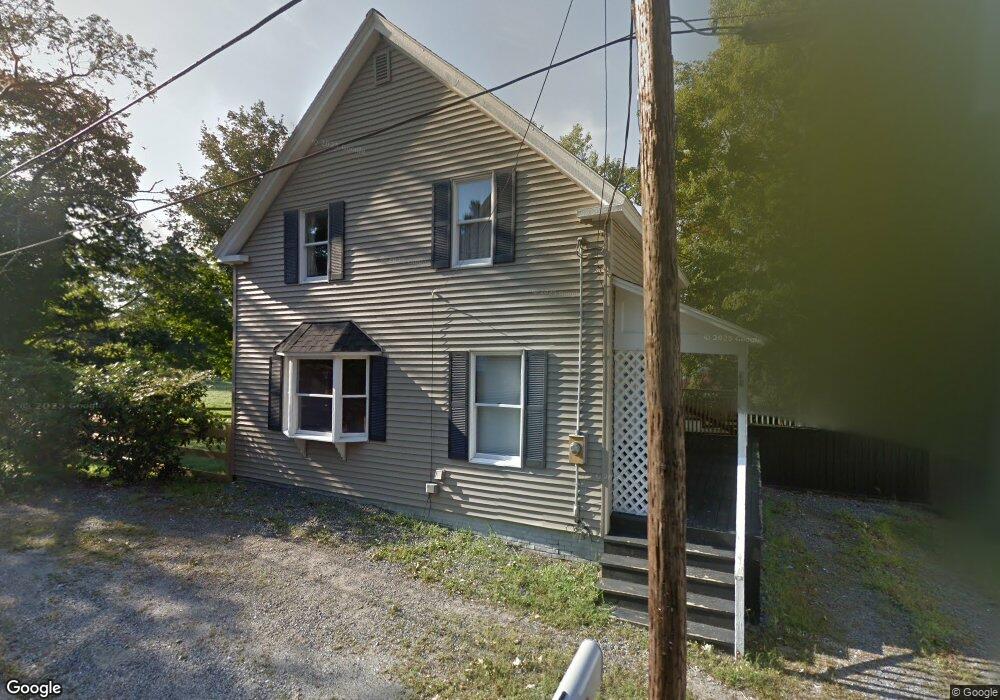
53 Logan St Berwick, ME 03901
Estimated Value: $330,000 - $352,000
3
Beds
2
Baths
1,183
Sq Ft
$286/Sq Ft
Est. Value
About This Home
This home is located at 53 Logan St, Berwick, ME 03901 and is currently estimated at $338,261, approximately $285 per square foot. 53 Logan St is a home located in York County with nearby schools including Noble High School and Tri-City Christian Academy.
Ownership History
Date
Name
Owned For
Owner Type
Purchase Details
Closed on
Apr 15, 2016
Sold by
Montgomery Matthew
Bought by
Montgomery Matthew and Montgomery Erika
Current Estimated Value
Home Financials for this Owner
Home Financials are based on the most recent Mortgage that was taken out on this home.
Original Mortgage
$104,000
Outstanding Balance
$81,382
Interest Rate
3.64%
Mortgage Type
New Conventional
Estimated Equity
$256,879
Purchase Details
Closed on
May 24, 2011
Sold by
Department Of Housing & Urban Dev
Bought by
Montgomery Matthew
Home Financials for this Owner
Home Financials are based on the most recent Mortgage that was taken out on this home.
Original Mortgage
$99,392
Interest Rate
4.88%
Mortgage Type
FHA
Purchase Details
Closed on
Jun 23, 2010
Sold by
Wells Fargo Bank Na
Bought by
Department Of Housing & Urban Dev
Create a Home Valuation Report for This Property
The Home Valuation Report is an in-depth analysis detailing your home's value as well as a comparison with similar homes in the area
Home Values in the Area
Average Home Value in this Area
Purchase History
| Date | Buyer | Sale Price | Title Company |
|---|---|---|---|
| Montgomery Matthew | -- | -- | |
| Montgomery Matthew | -- | -- | |
| Montgomery Matthew | $92,000 | -- | |
| Department Of Housing & Urban Dev | -- | -- | |
| Wells Fargo Bank Na | -- | -- |
Source: Public Records
Mortgage History
| Date | Status | Borrower | Loan Amount |
|---|---|---|---|
| Open | Montgomery Matthew | $104,000 | |
| Closed | Wells Fargo Bank Na | $104,000 | |
| Closed | Montgomery Matthew | $99,392 |
Source: Public Records
Tax History
| Year | Tax Paid | Tax Assessment Tax Assessment Total Assessment is a certain percentage of the fair market value that is determined by local assessors to be the total taxable value of land and additions on the property. | Land | Improvement |
|---|---|---|---|---|
| 2025 | $3,269 | $250,700 | $85,300 | $165,400 |
| 2024 | $3,126 | $250,700 | $85,300 | $165,400 |
| 2023 | $2,940 | $160,500 | $60,900 | $99,600 |
| 2022 | $2,924 | $160,500 | $60,900 | $99,600 |
| 2021 | $2,937 | $160,500 | $60,900 | $99,600 |
| 2020 | $2,815 | $160,500 | $60,900 | $99,600 |
| 2019 | $2,815 | $160,600 | $60,900 | $99,700 |
| 2018 | $2,658 | $155,000 | $56,000 | $99,000 |
| 2017 | $2,658 | $155,000 | $56,000 | $99,000 |
| 2016 | $1,673 | $155,000 | $56,000 | $99,000 |
| 2014 | $2,465 | $155,000 | $56,000 | $99,000 |
| 2013 | $2,488 | $155,000 | $56,000 | $99,000 |
Source: Public Records
Map
Nearby Homes
Your Personal Tour Guide
Ask me questions while you tour the home.