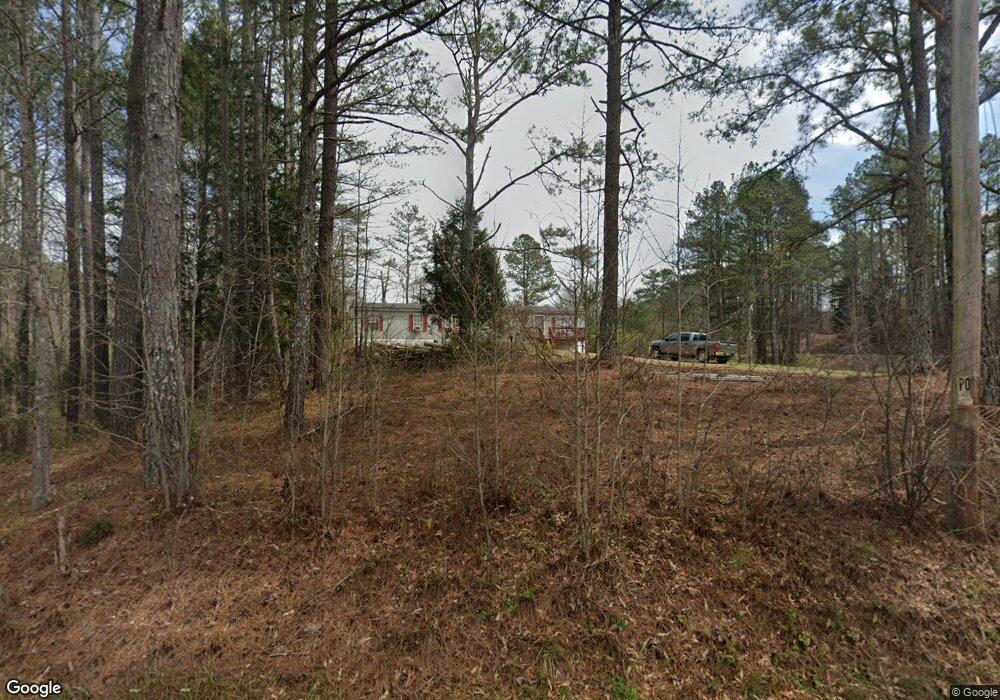
53 Lumpkin Rd Cedartown, GA 30125
Estimated Value: $45,987 - $228,000
3
Beds
2
Baths
1,782
Sq Ft
$70/Sq Ft
Est. Value
About This Home
This home is located at 53 Lumpkin Rd, Cedartown, GA 30125 and is currently estimated at $124,747, approximately $70 per square foot. 53 Lumpkin Rd is a home located in Polk County.
Ownership History
Date
Name
Owned For
Owner Type
Purchase Details
Closed on
Jul 1, 2021
Sold by
Duncan Chris
Bought by
Muhammad Rahim
Current Estimated Value
Purchase Details
Closed on
Sep 22, 2020
Sold by
Woodward Doyal W
Bought by
Duncan Chris and Duncan Jennie M
Purchase Details
Closed on
Mar 30, 2020
Sold by
Baker Lora
Bought by
Woodward Doyal W and Woodward Cindy W
Purchase Details
Closed on
Feb 3, 2009
Sold by
Cantrell John Floyd
Bought by
Baker Lora Lyn
Purchase Details
Closed on
Jul 25, 2003
Sold by
Vance Brandy K and Olivet Kathy G
Bought by
Cantrell John
Purchase Details
Closed on
Feb 3, 2003
Sold by
Goodwin Melody L
Bought by
Vance Brandy K
Purchase Details
Closed on
Aug 7, 1996
Sold by
Vance Brandy K and Godwin Melody L
Bought by
Olivet Kathy G
Purchase Details
Closed on
Feb 12, 1987
Sold by
Griffith Kathleen H
Bought by
Olivet Kathy G
Purchase Details
Closed on
Feb 22, 1979
Sold by
Griffith Jack W
Bought by
Griffith Kathleen H
Purchase Details
Closed on
Apr 14, 1972
Bought by
Griffith Jack W
Create a Home Valuation Report for This Property
The Home Valuation Report is an in-depth analysis detailing your home's value as well as a comparison with similar homes in the area
Home Values in the Area
Average Home Value in this Area
Purchase History
| Date | Buyer | Sale Price | Title Company |
|---|---|---|---|
| Muhammad Rahim | $30,000 | -- | |
| Duncan Chris | $15,500 | -- | |
| Woodward Doyal W | $17,000 | -- | |
| Baker Lora Lyn | -- | -- | |
| Cantrell John | $40,000 | -- | |
| Vance Brandy K | -- | -- | |
| Olivet Kathy G | -- | -- | |
| Vance Brandy K | -- | -- | |
| Olivet Kathy G | -- | -- | |
| Griffith Kathleen H | -- | -- | |
| Griffith Jack W | -- | -- |
Source: Public Records
Tax History Compared to Growth
Tax History
| Year | Tax Paid | Tax Assessment Tax Assessment Total Assessment is a certain percentage of the fair market value that is determined by local assessors to be the total taxable value of land and additions on the property. | Land | Improvement |
|---|---|---|---|---|
| 2024 | $169 | $8,068 | $6,964 | $1,104 |
| 2023 | $170 | $11,814 | $0 | $11,814 |
| 2022 | $136 | $5,747 | $4,643 | $1,104 |
| 2021 | $112 | $4,643 | $4,643 | $0 |
| 2020 | $89 | $3,714 | $3,714 | $0 |
| 2019 | $100 | $3,714 | $3,714 | $0 |
| 2018 | $102 | $3,714 | $3,714 | $0 |
| 2017 | $101 | $3,714 | $3,714 | $0 |
| 2016 | $132 | $4,833 | $4,833 | $0 |
| 2015 | $132 | $4,833 | $4,833 | $0 |
| 2014 | $133 | $4,833 | $4,833 | $0 |
Source: Public Records
Map
Nearby Homes
- 0 Treat Mountain Rd Unit 7643015
- 0 Treat Mountain Rd Unit 7634123
- 0 Treat Mountain Rd Unit 10586157
- 745 Brewster Field Rd
- 440 Treat Mountain Rd
- TR 2 Culp Lake Rd
- TR 3 Culp Lake Rd
- 812 Brewster Field Rd
- 1806 Piedmont Hwy
- 1810 Piedmont Hwy
- 0 Prior Station Rd Unit 7655613
- 0 Prior Station Rd Unit TRACT 1 10612520
- 0 Prior Station Rd Unit 23482404
- 0 Prior Station Rd Unit 10506511
- 0 Prior Station Rd Unit 7565415
- 0 Prior Station Rd Unit TRACT 4 10493804
- 0 Prior Station Rd Unit 7553984
- 0 Prior Station Rd Unit LotWP001 21901671
- 4244 Prior Station Rd
- 8702 Us Highway 278
- 58 Lumpkin Rd
- 83 Lumpkin Rd
- 105 Lumpkin Rd
- 107 Lumpkin Rd
- 42 Lumpkin Rd
- 3800 Piedmont Hwy
- 51 M C Beck Rd
- 183 Lumpkin Rd
- 3844 Piedmont Hwy
- 3615 Piedmont Hwy
- 3571 Piedmont Hwy
- 3954 Piedmont Hwy
- 3954 Piedmont Hwy
- 96 Lumpkin Rd
- 3566 Piedmont Hwy
- 3529 Piedmont Hwy
- 3536 Piedmont Hwy
- 3520 Piedmont Hwy
- 3459 Piedmont Hwy
- 337 Lumpkin Rd