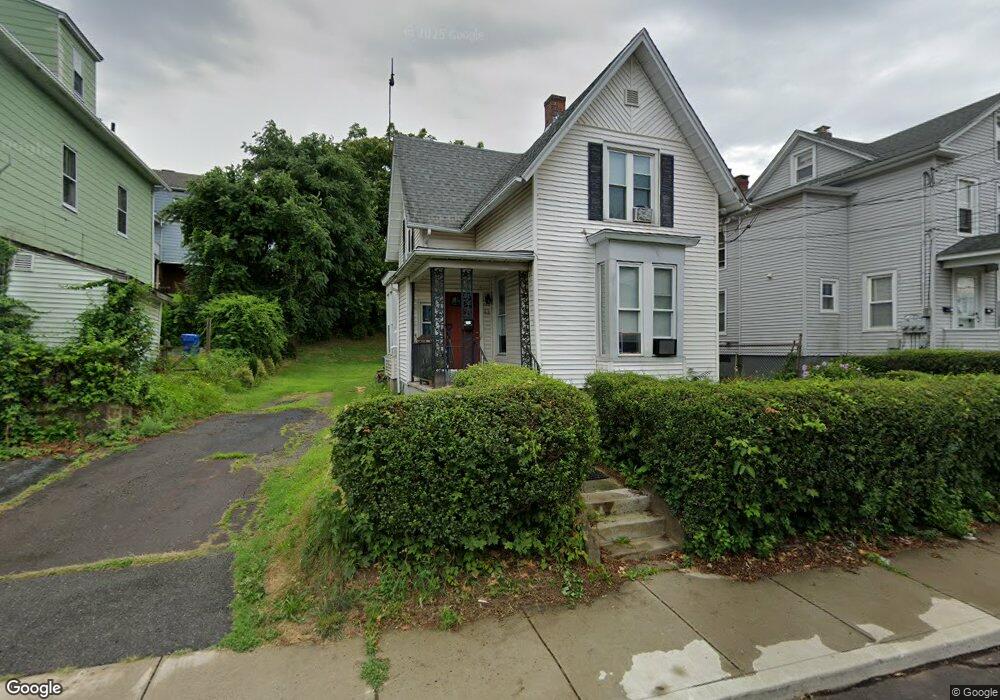
53 Maple St Meriden, CT 06451
Estimated Value: $249,000 - $274,000
5
Beds
2
Baths
1,407
Sq Ft
$187/Sq Ft
Est. Value
About This Home
This home is located at 53 Maple St, Meriden, CT 06451 and is currently estimated at $262,713, approximately $186 per square foot. 53 Maple St is a home located in New Haven County with nearby schools including John Barry School, Lincoln Middle School, and Orville H. Platt High School.
Ownership History
Date
Name
Owned For
Owner Type
Purchase Details
Closed on
Jul 20, 2009
Sold by
Department Of Housing & Urban Dev
Bought by
Ieraci Kevin J
Current Estimated Value
Purchase Details
Closed on
Nov 25, 2008
Sold by
Southland Kevin
Bought by
Countrywide Home Loans
Purchase Details
Closed on
Jun 22, 2005
Sold by
Cleary T Kevin
Bought by
Southland Kevin and Southland Ann Marie
Purchase Details
Closed on
Dec 17, 2004
Sold by
Wells Fargo Bk Minneso
Bought by
Cleary T Kevin
Purchase Details
Closed on
Mar 1, 2002
Sold by
Torres Jose and Torres Virgen
Bought by
Thompson Clarence
Create a Home Valuation Report for This Property
The Home Valuation Report is an in-depth analysis detailing your home's value as well as a comparison with similar homes in the area
Home Values in the Area
Average Home Value in this Area
Purchase History
| Date | Buyer | Sale Price | Title Company |
|---|---|---|---|
| Ieraci Kevin J | $60,000 | -- | |
| Countrywide Home Loans | -- | -- | |
| Southland Kevin | $149,900 | -- | |
| Cleary T Kevin | $90,000 | -- | |
| Thompson Clarence | $79,900 | -- |
Source: Public Records
Mortgage History
| Date | Status | Borrower | Loan Amount |
|---|---|---|---|
| Open | Thompson Clarence | $107,600 | |
| Closed | Thompson Clarence | $18,200 |
Source: Public Records
Tax History
| Year | Tax Paid | Tax Assessment Tax Assessment Total Assessment is a certain percentage of the fair market value that is determined by local assessors to be the total taxable value of land and additions on the property. | Land | Improvement |
|---|---|---|---|---|
| 2025 | $4,089 | $107,870 | $26,110 | $81,760 |
| 2024 | $4,154 | $107,870 | $26,110 | $81,760 |
| 2023 | $4,004 | $107,870 | $26,110 | $81,760 |
| 2022 | $3,778 | $107,870 | $26,110 | $81,760 |
| 2021 | $3,193 | $73,360 | $21,910 | $51,450 |
| 2020 | $3,185 | $73,360 | $21,910 | $51,450 |
| 2019 | $3,157 | $73,360 | $21,910 | $51,450 |
| 2018 | $3,170 | $73,360 | $21,910 | $51,450 |
| 2017 | $3,086 | $73,360 | $21,910 | $51,450 |
| 2016 | $3,498 | $90,230 | $24,500 | $65,730 |
| 2015 | $3,498 | $90,230 | $24,500 | $65,730 |
| 2014 | $3,413 | $90,230 | $24,500 | $65,730 |
Source: Public Records
Map
Nearby Homes
- 55 Lewis Ave
- 49 Prospect St
- 14 North St
- 200 W Main St
- 230 W Main St
- 33 W Main St Unit 11
- 33 W Main St Unit 16
- 33 W Main St Unit 17
- 33 W Main St Unit 1
- 236 W Main St
- 171 Foster St
- 23 N 1st St
- 61 Randolph Ave
- 27 Windsor Ave
- 74 Randolph Ave
- 56 N First St
- 185 Springdale Ave
- 86 Linsley Ave
- 243 Grove St
- 44 4th St
Your Personal Tour Guide
Ask me questions while you tour the home.