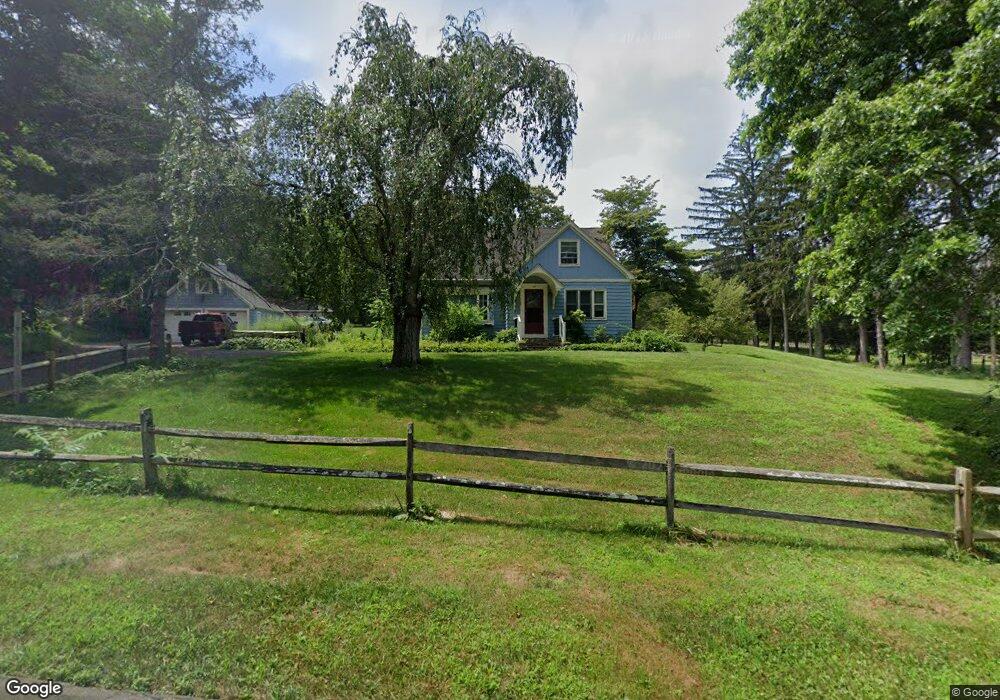
53 Mapleview Rd Wallingford, CT 06492
Estimated Value: $563,000 - $731,718
Studio
2
Baths
--
Sq Ft
159,865
Sq Ft Lot
About This Home
This home is located at 53 Mapleview Rd, Wallingford, CT 06492 and is currently estimated at $660,930. 53 Mapleview Rd is a home located in New Haven County with nearby schools including Moses Y Beach Elementary School, Rock Hill Elementary School, and Dag Hammarskjold Middle School.
Ownership History
Date
Name
Owned For
Owner Type
Purchase Details
Closed on
Sep 28, 2018
Sold by
Rascati Frank
Bought by
Ftr Properties Llc
Current Estimated Value
Home Financials for this Owner
Home Financials are based on the most recent Mortgage that was taken out on this home.
Original Mortgage
$330,000
Outstanding Balance
$287,780
Interest Rate
4.5%
Mortgage Type
Credit Line Revolving
Estimated Equity
$373,150
Purchase Details
Closed on
Sep 21, 2015
Sold by
Wallace Carol and Jewczyn Michael
Bought by
Mapleview Properties L
Create a Home Valuation Report for This Property
The Home Valuation Report is an in-depth analysis detailing your home's value as well as a comparison with similar homes in the area
Home Values in the Area
Average Home Value in this Area
Purchase History
| Date | Buyer | Sale Price | Title Company |
|---|---|---|---|
| Ftr Properties Llc | -- | -- | |
| Rascati Frank | $350,000 | -- | |
| Mapleview Properties L | -- | -- |
Source: Public Records
Mortgage History
| Date | Status | Borrower | Loan Amount |
|---|---|---|---|
| Open | Mapleview Properties L | $330,000 |
Source: Public Records
Tax History
| Year | Tax Paid | Tax Assessment Tax Assessment Total Assessment is a certain percentage of the fair market value that is determined by local assessors to be the total taxable value of land and additions on the property. | Land | Improvement |
|---|---|---|---|---|
| 2025 | $11,351 | $470,600 | $128,800 | $341,800 |
| 2024 | $9,299 | $303,300 | $107,300 | $196,000 |
| 2023 | $8,899 | $303,300 | $107,300 | $196,000 |
| 2022 | $8,808 | $303,300 | $107,300 | $196,000 |
| 2021 | $8,650 | $303,300 | $107,300 | $196,000 |
| 2020 | $8,498 | $291,130 | $103,200 | $187,930 |
| 2019 | $8,498 | $291,130 | $103,200 | $187,930 |
| 2018 | $8,876 | $309,900 | $103,200 | $206,700 |
| 2017 | $9,493 | $332,500 | $125,800 | $206,700 |
| 2016 | $9,273 | $332,500 | $125,800 | $206,700 |
| 2015 | $8,941 | $325,500 | $125,800 | $199,700 |
| 2014 | $8,793 | $327,000 | $125,800 | $201,200 |
Source: Public Records
Map
Nearby Homes
- 19 Perkins Dr
- 1 Dean Dr
- 58 Grieb Rd
- 101 Grieb Rd
- 1095 Durham Rd
- 39 Farm Hill Rd
- 2 Twin Pines Dr
- 4 Martin Trail
- 570 N Main St
- 134 E Main St
- 71 Cedar Ln
- 147 Constitution St
- 50 Carr St
- 924 E Center St
- 116 Putter Dr Unit 116
- 70 Putter Dr Unit 211
- 16 Putter Dr Unit 207S
- 21 Putter Dr Unit 303S
- 85 N Colony St
- 229 Woodhouse Ave
Your Personal Tour Guide
Ask me questions while you tour the home.