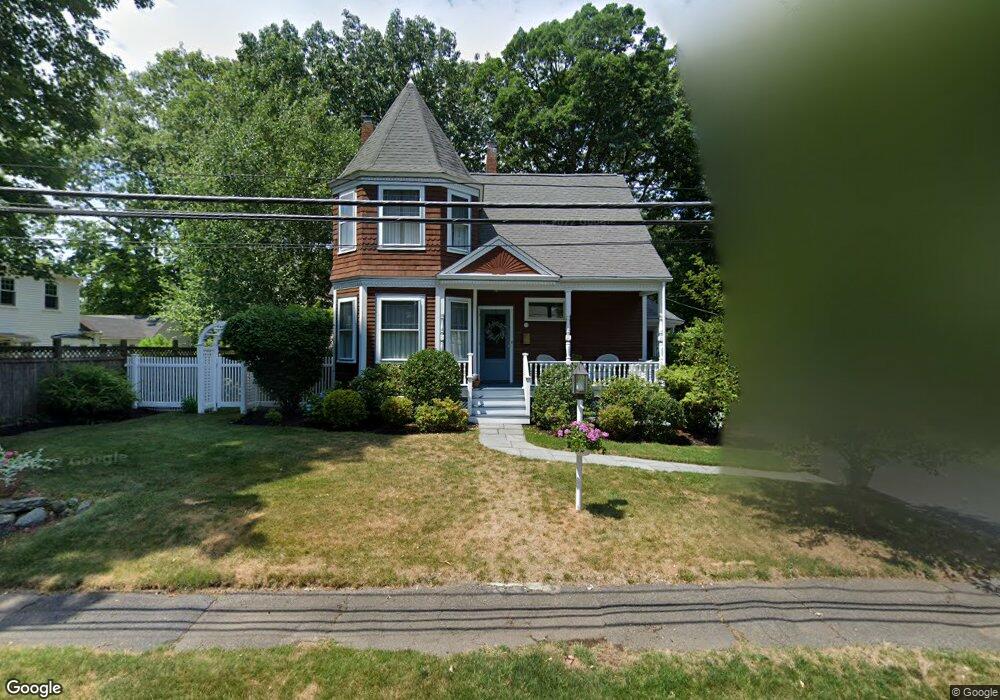
53 Marshall St Needham, MA 02492
Estimated Value: $1,238,000 - $1,775,000
3
Beds
3
Baths
1,342
Sq Ft
$1,056/Sq Ft
Est. Value
About This Home
This home is located at 53 Marshall St, Needham, MA 02492 and is currently estimated at $1,416,523, approximately $1,055 per square foot. 53 Marshall St is a home located in Norfolk County with nearby schools including High Rock Middle School, Sunita L. Williams Elementary School, and Pollard Middle School.
Ownership History
Date
Name
Owned For
Owner Type
Purchase Details
Closed on
Dec 29, 2023
Sold by
Ballinger John M
Bought by
John M Ballnger Jr Ret and Ballinger
Current Estimated Value
Purchase Details
Closed on
Nov 28, 1986
Bought by
Ballinger John M
Create a Home Valuation Report for This Property
The Home Valuation Report is an in-depth analysis detailing your home's value as well as a comparison with similar homes in the area
Home Values in the Area
Average Home Value in this Area
Purchase History
| Date | Buyer | Sale Price | Title Company |
|---|---|---|---|
| John M Ballnger Jr Ret | -- | None Available | |
| John M Ballnger Jr Ret | -- | None Available | |
| Ballinger John M | $240,000 | -- |
Source: Public Records
Mortgage History
| Date | Status | Borrower | Loan Amount |
|---|---|---|---|
| Previous Owner | Ballinger John M | $190,500 | |
| Previous Owner | Ballinger John M | $198,500 |
Source: Public Records
Tax History
| Year | Tax Paid | Tax Assessment Tax Assessment Total Assessment is a certain percentage of the fair market value that is determined by local assessors to be the total taxable value of land and additions on the property. | Land | Improvement |
|---|---|---|---|---|
| 2025 | $10,877 | $1,026,100 | $725,900 | $300,200 |
| 2024 | $11,122 | $888,300 | $529,700 | $358,600 |
| 2023 | $11,180 | $857,400 | $529,700 | $327,700 |
| 2022 | $10,891 | $814,600 | $499,900 | $314,700 |
| 2021 | $10,614 | $814,600 | $499,900 | $314,700 |
| 2020 | $10,163 | $813,700 | $499,900 | $313,800 |
| 2019 | $9,428 | $760,900 | $454,800 | $306,100 |
| 2018 | $9,039 | $760,900 | $454,800 | $306,100 |
| 2017 | $8,621 | $725,100 | $454,800 | $270,300 |
| 2016 | $8,368 | $725,100 | $454,800 | $270,300 |
| 2015 | $8,186 | $725,100 | $454,800 | $270,300 |
| 2014 | $7,891 | $677,900 | $413,800 | $264,100 |
Source: Public Records
Map
Nearby Homes
- 193 Garden St
- 73 Maple St Unit 1
- 19 Highland Ct Unit 19
- 19 Oakland Ave Unit 19
- 52 Hancock Rd
- 233 Warren St
- 3 Hancock Rd
- 620 High Rock St
- 68 Pleasant St Unit 68
- 100 Rosemary Way Unit 129
- 638 Webster St
- 638 Webster St Unit 638
- 95 Deerfield Rd
- 90 Norfolk St
- 102 Jarvis Cir Unit 102
- 36 Otis St Unit 36
- 287 High Rock St
- 100 Bradford St
- 447 Hillside Ave
- 81 Parish Rd
- 52 Gage St
- 46 Gage St Unit 2
- 44 Gage St
- 44 Gage St Unit 1
- 36 Brentwood Cir
- 52 Marshall St
- 40 Brentwood Cir
- 48 Marshall St
- 58 Marshall St
- 58 Marshall St Unit 3
- 58 Marshall St Unit 2
- 58 Marshall St Unit 1
- 42 Marshall St
- 36 Gage St
- 46 Brentwood Cir
- 69 Marshall St
- 15 Washburn Ave
- 32 Brentwood Cir
- 43 Gage St
- 70 Marshall St
Your Personal Tour Guide
Ask me questions while you tour the home.